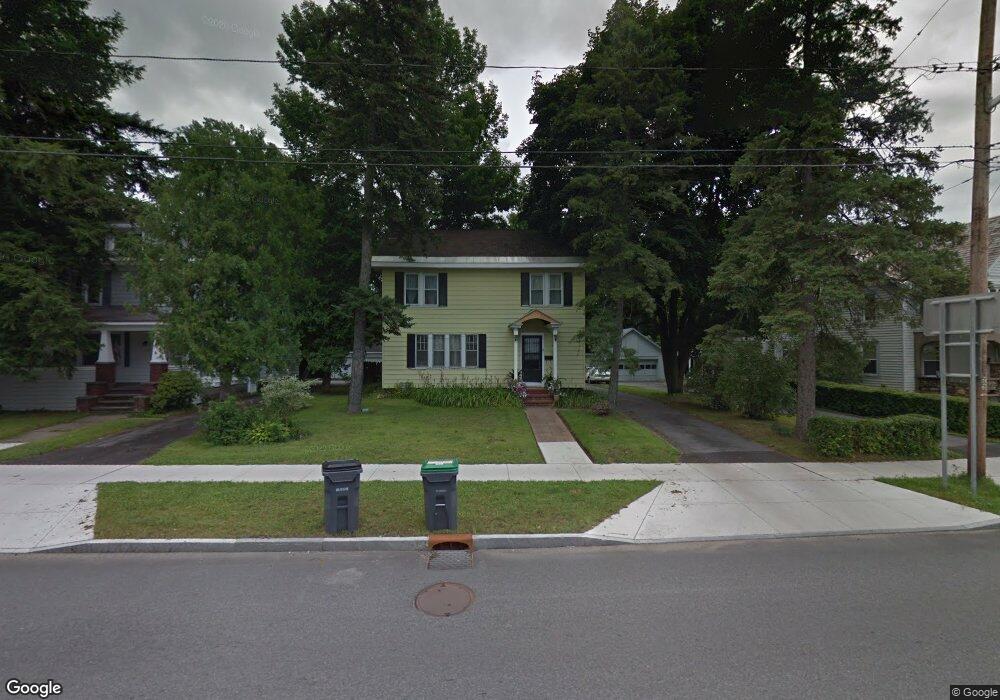
2 Main St Hudson Falls, NY 12839
Estimated Value: $210,000 - $257,971
4
Beds
2
Baths
1,840
Sq Ft
$130/Sq Ft
Est. Value
About This Home
This home is located at 2 Main St, Hudson Falls, NY 12839 and is currently estimated at $239,493, approximately $130 per square foot. 2 Main St is a home located in Washington County with nearby schools including Margaret Murphy Kindergarten Center, Hudson Falls Intermediate School, and Hudson Falls Primary School.
Ownership History
Date
Name
Owned For
Owner Type
Purchase Details
Closed on
Mar 18, 2020
Sold by
Messier Gerald L and Messier Yolanda O
Bought by
Messier Timothy
Current Estimated Value
Home Financials for this Owner
Home Financials are based on the most recent Mortgage that was taken out on this home.
Original Mortgage
$117,300
Interest Rate
3.3%
Mortgage Type
Purchase Money Mortgage
Purchase Details
Closed on
Feb 5, 2007
Sold by
Rozell Anthony
Bought by
Messier Gerald
Home Financials for this Owner
Home Financials are based on the most recent Mortgage that was taken out on this home.
Original Mortgage
$110,500
Interest Rate
6.23%
Mortgage Type
Purchase Money Mortgage
Purchase Details
Closed on
Aug 26, 1999
Sold by
Rozell Anthony L
Bought by
Etal Rozell Matthew
Purchase Details
Closed on
Mar 15, 1996
Sold by
Wadsworth Morris F
Bought by
Cambridge Valley Farm And Gar
Create a Home Valuation Report for This Property
The Home Valuation Report is an in-depth analysis detailing your home's value as well as a comparison with similar homes in the area
Home Values in the Area
Average Home Value in this Area
Purchase History
| Date | Buyer | Sale Price | Title Company |
|---|---|---|---|
| Messier Timothy | $130,400 | None Available | |
| Messier Gerald | $110,500 | -- | |
| Etal Rozell Matthew | -- | -- | |
| Cambridge Valley Farm And Gar | $85,000 | -- |
Source: Public Records
Mortgage History
| Date | Status | Borrower | Loan Amount |
|---|---|---|---|
| Previous Owner | Messier Timothy | $117,300 | |
| Previous Owner | Messier Gerald | $110,500 |
Source: Public Records
Tax History Compared to Growth
Tax History
| Year | Tax Paid | Tax Assessment Tax Assessment Total Assessment is a certain percentage of the fair market value that is determined by local assessors to be the total taxable value of land and additions on the property. | Land | Improvement |
|---|---|---|---|---|
| 2024 | $5,090 | $196,600 | $9,100 | $187,500 |
| 2023 | $4,615 | $172,500 | $9,100 | $163,400 |
| 2022 | $4,390 | $162,700 | $9,100 | $153,600 |
| 2021 | $4,188 | $146,200 | $9,100 | $137,100 |
| 2020 | $4,191 | $130,500 | $7,700 | $122,800 |
| 2019 | -- | $130,500 | $7,700 | $122,800 |
| 2018 | $3,065 | $127,000 | $7,700 | $119,300 |
| 2017 | $3,131 | $124,400 | $7,700 | $116,700 |
| 2016 | $3,243 | $124,400 | $7,700 | $116,700 |
| 2015 | -- | $126,900 | $7,700 | $119,200 |
| 2014 | -- | $129,500 | $7,700 | $121,800 |
Source: Public Records
Map
Nearby Homes