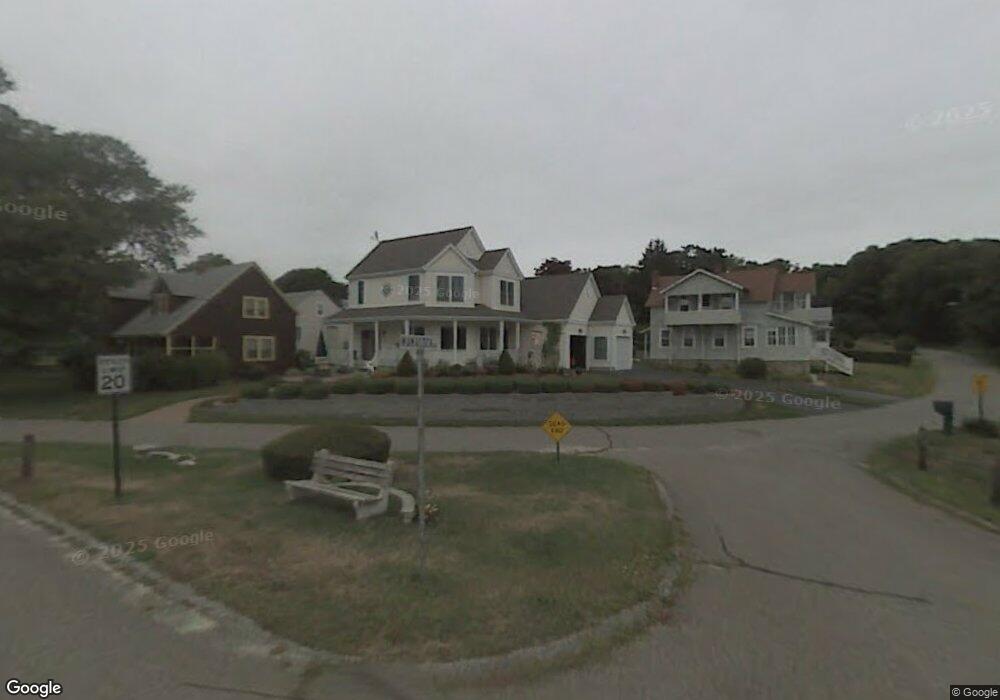
2 Mamacock Rd Niantic, CT 06357
Estimated Value: $1,090,141 - $1,383,000
3
Beds
3
Baths
2,326
Sq Ft
$528/Sq Ft
Est. Value
About This Home
This home is located at 2 Mamacock Rd, Niantic, CT 06357 and is currently estimated at $1,228,714, approximately $528 per square foot. 2 Mamacock Rd is a home located in New London County with nearby schools including East Lyme Middle School, East Lyme High School, and Lighthouse Vocation Education Center.
Ownership History
Date
Name
Owned For
Owner Type
Purchase Details
Closed on
Aug 3, 2015
Sold by
Lawrence K Cole Ret and Cole Katherine L
Bought by
Plisic Ljiljana and Brienza Toni
Current Estimated Value
Home Financials for this Owner
Home Financials are based on the most recent Mortgage that was taken out on this home.
Original Mortgage
$511,920
Outstanding Balance
$397,354
Interest Rate
3.97%
Estimated Equity
$831,360
Purchase Details
Closed on
Dec 9, 1994
Sold by
Leone William A
Bought by
Cole Lawrence K
Create a Home Valuation Report for This Property
The Home Valuation Report is an in-depth analysis detailing your home's value as well as a comparison with similar homes in the area
Home Values in the Area
Average Home Value in this Area
Purchase History
| Date | Buyer | Sale Price | Title Company |
|---|---|---|---|
| Plisic Ljiljana | $639,900 | -- | |
| Cole Lawrence K | $125,000 | -- |
Source: Public Records
Mortgage History
| Date | Status | Borrower | Loan Amount |
|---|---|---|---|
| Open | Cole Lawrence K | $511,920 | |
| Previous Owner | Cole Lawrence K | $50,000 | |
| Previous Owner | Cole Lawrence K | $370,000 |
Source: Public Records
Tax History
| Year | Tax Paid | Tax Assessment Tax Assessment Total Assessment is a certain percentage of the fair market value that is determined by local assessors to be the total taxable value of land and additions on the property. | Land | Improvement |
|---|---|---|---|---|
| 2025 | $13,672 | $488,110 | $274,400 | $213,710 |
| 2024 | $12,862 | $488,110 | $274,400 | $213,710 |
| 2023 | $12,144 | $488,110 | $274,400 | $213,710 |
| 2022 | $11,637 | $488,110 | $274,400 | $213,710 |
| 2021 | $12,072 | $423,430 | $266,980 | $156,450 |
| 2020 | $11,985 | $422,590 | $266,980 | $155,610 |
| 2019 | $11,410 | $404,740 | $266,980 | $137,760 |
| 2018 | $11,070 | $404,740 | $266,980 | $137,760 |
| 2017 | $10,202 | $389,970 | $266,980 | $122,990 |
| 2016 | $9,011 | $355,320 | $233,590 | $121,730 |
| 2015 | $8,780 | $355,320 | $233,590 | $121,730 |
| 2014 | $8,538 | $355,320 | $233,590 | $121,730 |
Source: Public Records
Map
Nearby Homes
- 15 Griswold Rd
- 12 Spinnaker Dr
- 19 Sapia Dr
- 22 Riverdale Landing
- 26 Mohawk Dr
- 61 Whitecap Rd
- 36 Attawan Rd
- 86 Corey Ln
- 127 Black Point Rd Unit 7
- 2 Riverdale Landing
- 55 Corey Ln
- 15 Freedom Way Unit 105
- 15 Freedom Way Unit 92
- 42 S Washington Ave
- 97 W Main St Unit 36
- 43 Roxbury Ct
- 14 Colton Rd
- 47 Village Crossing Unit 47
- 46 Village Crossing Unit 46
- 14 Cutler Rd
- 35 Brockett Rd
- 6 Mamacock Rd
- 37 Brockett Rd
- 39 Brockett Rd
- 47 1/2 Brockett Rd
- 41 Brockett Rd
- 31 Brockett Rd
- 8 Mamacock Rd
- 43 Brockett Rd
- 29 Brockett Rd
- 10 Mamacock Rd
- 45 Brockett Rd
- 27 Brockett Rd
- 36 Brockett Rd
- 42 Brockett Rd
- 47 Brockett Rd
- 44 Brockett Rd
- 14 Mamacock Rd
- 49 Brockett Rd
- 46 Brockett Rd
Your Personal Tour Guide
Ask me questions while you tour the home.