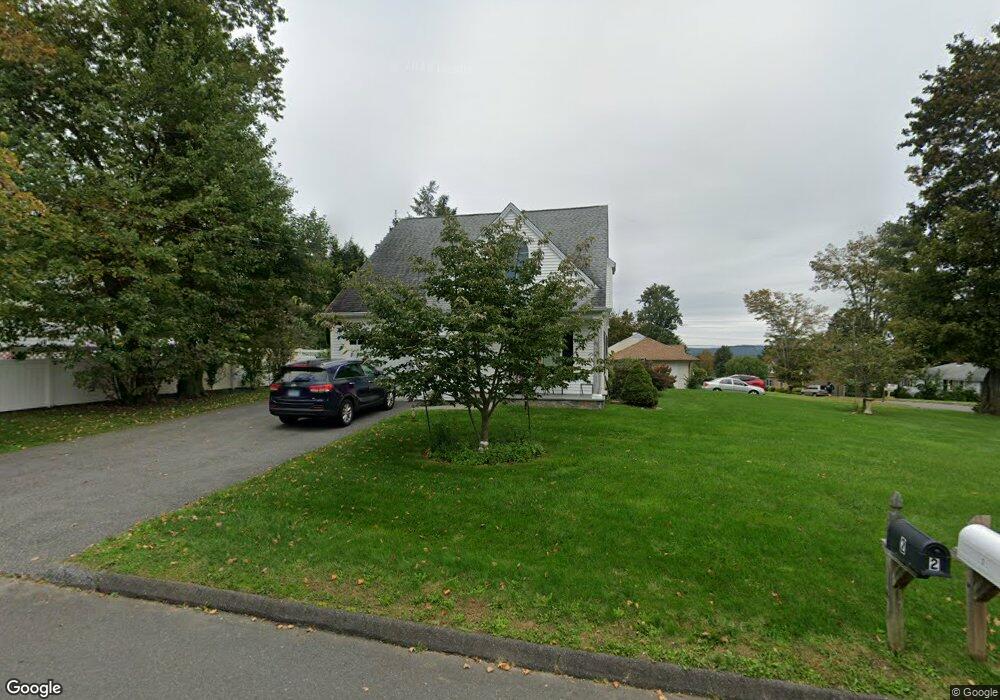
2 Manning St New Fairfield, CT 06812
Estimated Value: $526,945 - $601,000
3
Beds
2
Baths
1,810
Sq Ft
$310/Sq Ft
Est. Value
About This Home
This home is located at 2 Manning St, New Fairfield, CT 06812 and is currently estimated at $560,236, approximately $309 per square foot. 2 Manning St is a home located in Fairfield County with nearby schools including Meeting House Hill School, New Fairfield Middle School, and New Fairfield High School.
Ownership History
Date
Name
Owned For
Owner Type
Purchase Details
Closed on
May 28, 2025
Sold by
Reilly Sr Joseph B Est and Reilly
Bought by
84 Route 37 Llc
Current Estimated Value
Purchase Details
Closed on
Sep 1, 2021
Sold by
Reilly Maureen
Bought by
Reilly Joseph B
Purchase Details
Closed on
May 19, 2014
Sold by
Mcintyre Kevin
Bought by
Reilly Joseph B and Reilly Maureen
Create a Home Valuation Report for This Property
The Home Valuation Report is an in-depth analysis detailing your home's value as well as a comparison with similar homes in the area
Home Values in the Area
Average Home Value in this Area
Purchase History
| Date | Buyer | Sale Price | Title Company |
|---|---|---|---|
| 84 Route 37 Llc | -- | None Available | |
| 84 Route 37 Llc | -- | None Available | |
| Reilly Joseph B | -- | None Available | |
| Reilly Joseph B | $55,000 | -- | |
| Reilly Joseph B | $55,000 | -- |
Source: Public Records
Mortgage History
| Date | Status | Borrower | Loan Amount |
|---|---|---|---|
| Previous Owner | Reilly Joseph B | $26,212 |
Source: Public Records
Tax History
| Year | Tax Paid | Tax Assessment Tax Assessment Total Assessment is a certain percentage of the fair market value that is determined by local assessors to be the total taxable value of land and additions on the property. | Land | Improvement |
|---|---|---|---|---|
| 2025 | $9,155 | $347,700 | $60,300 | $287,400 |
| 2024 | $7,808 | $213,800 | $56,100 | $157,700 |
| 2023 | $7,462 | $213,800 | $56,100 | $157,700 |
| 2022 | $6,942 | $213,800 | $56,100 | $157,700 |
| 2021 | $6,733 | $213,800 | $56,100 | $157,700 |
| 2020 | $6,538 | $213,800 | $56,100 | $157,700 |
| 2019 | $6,044 | $195,600 | $45,800 | $149,800 |
| 2018 | $5,981 | $195,600 | $45,800 | $149,800 |
| 2017 | $5,833 | $195,600 | $45,800 | $149,800 |
| 2016 | $5,580 | $195,600 | $45,800 | $149,800 |
| 2015 | $5,580 | $195,600 | $45,800 | $149,800 |
| 2014 | $441 | $16,900 | $16,900 | $0 |
Source: Public Records
Map
Nearby Homes
Your Personal Tour Guide
Ask me questions while you tour the home.