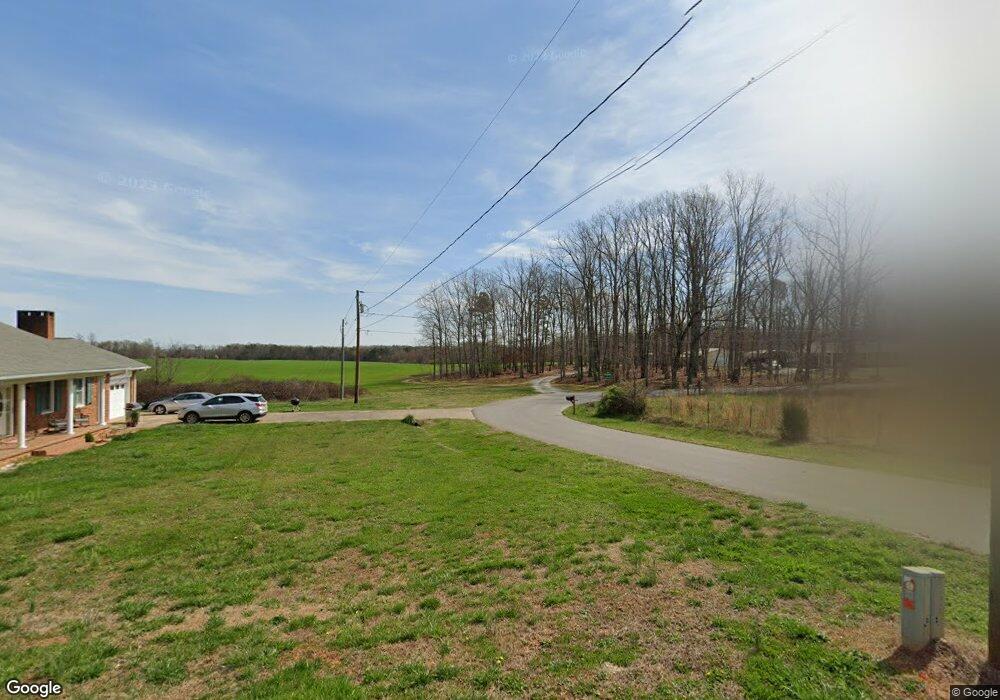
2 Maple Spring Lawndale, NC 28090
Estimated Value: $141,000 - $296,000
Studio
--
Bath
864
Sq Ft
$250/Sq Ft
Est. Value
About This Home
This home is located at 2 Maple Spring, Lawndale, NC 28090 and is currently estimated at $216,000, approximately $250 per square foot. 2 Maple Spring is a home with nearby schools including Boiling Springs Elementary School, Crest Middle School, and Crest High School.
Ownership History
Date
Name
Owned For
Owner Type
Purchase Details
Closed on
Jul 27, 2023
Sold by
Roberts Thad C and Roberts Sandra M
Bought by
Cook Christopher N
Current Estimated Value
Purchase Details
Closed on
Sep 26, 2013
Sold by
Cook Christopher N
Bought by
Roberts Thad Carroll
Purchase Details
Closed on
Oct 12, 2005
Sold by
Vinesett Wallace C and Vinesett Doris E
Bought by
Cook Christopher N and Cook Dawn L
Create a Home Valuation Report for This Property
The Home Valuation Report is an in-depth analysis detailing your home's value as well as a comparison with similar homes in the area
Home Values in the Area
Average Home Value in this Area
Purchase History
| Date | Buyer | Sale Price | Title Company |
|---|---|---|---|
| Cook Christopher N | -- | None Listed On Document | |
| Roberts Thad Carroll | -- | None Available | |
| Cook Christopher N | $28,000 | None Available |
Source: Public Records
Tax History
| Year | Tax Paid | Tax Assessment Tax Assessment Total Assessment is a certain percentage of the fair market value that is determined by local assessors to be the total taxable value of land and additions on the property. | Land | Improvement |
|---|---|---|---|---|
| 2025 | $1,588 | $250,146 | $90,506 | $159,640 |
| 2024 | $1,177 | $137,974 | $50,695 | $87,279 |
| 2023 | $1,342 | $160,384 | $74,125 | $86,259 |
| 2022 | $1,349 | $160,384 | $74,125 | $86,259 |
| 2021 | $1,353 | $160,384 | $74,125 | $86,259 |
| 2020 | $1,229 | $139,566 | $72,042 | $67,524 |
| 2019 | $1,229 | $139,566 | $72,042 | $67,524 |
| 2018 | $1,224 | $139,566 | $72,042 | $67,524 |
| 2017 | $1,218 | $139,566 | $72,042 | $67,524 |
| 2016 | $1,165 | $139,566 | $72,042 | $67,524 |
| 2015 | $1,208 | $145,049 | $76,099 | $68,950 |
| 2014 | $1,010 | $127,811 | $76,099 | $51,712 |
Source: Public Records
Map
Nearby Homes
- 147 Keen Dr
- 143 Keen Dr
- 2317 Flint Hill Church Rd
- 1815 Gaffney Rd
- 1013 Point Crossing Ct Unit 25
- 125 Flint Hill Church Rd
- 2125 Riverside Rd Unit 1
- 1033 College Ave
- 322 S Main St
- 245 E College Ave
- 112 Woodhill Dr
- 0 Harlans Rd
- 16 Harlans Rd
- 241 Howington St
- 109 Ocean Dr
- 1617 Red Rd
- 117 Ocean Dr
- 129 Creekside Dr
- 0 W College Ave
- 300 Hidden Creek Dr
- 1650 Maple Springs Ch Rd
- 1648 Maple Springs Ch Rd
- 1644 Maple Springs Ch Rd
- 1640 Maple Springs Church Rd
- 1642 Maple Springs Ch Rd
- 1668 Maple Springs Ch Rd
- 1668 Maple Springs Ch Rd
- 1674 Maple Springs Ch Rd
- 1634 Maple Springs Ch Rd
- 1641 Maple Springs Church Rd
- 1641 Maple Springs Ch Rd
- 1639 Maple Springs Ch Rd
- 1719 Maple Springs Ch Rd
- 2051 Flint Hill Church Rd
- 1630 Maple Springs Ch Rd
- 1635 Maple Springs Ch Rd
- 1631 Maple Springs Ch Rd
- 1715 Maple Springs Ch Rd
- 1614 Maple Springs Ch Rd
- 1615 Maple Springs Ch Rd
Your Personal Tour Guide
Ask me questions while you tour the home.