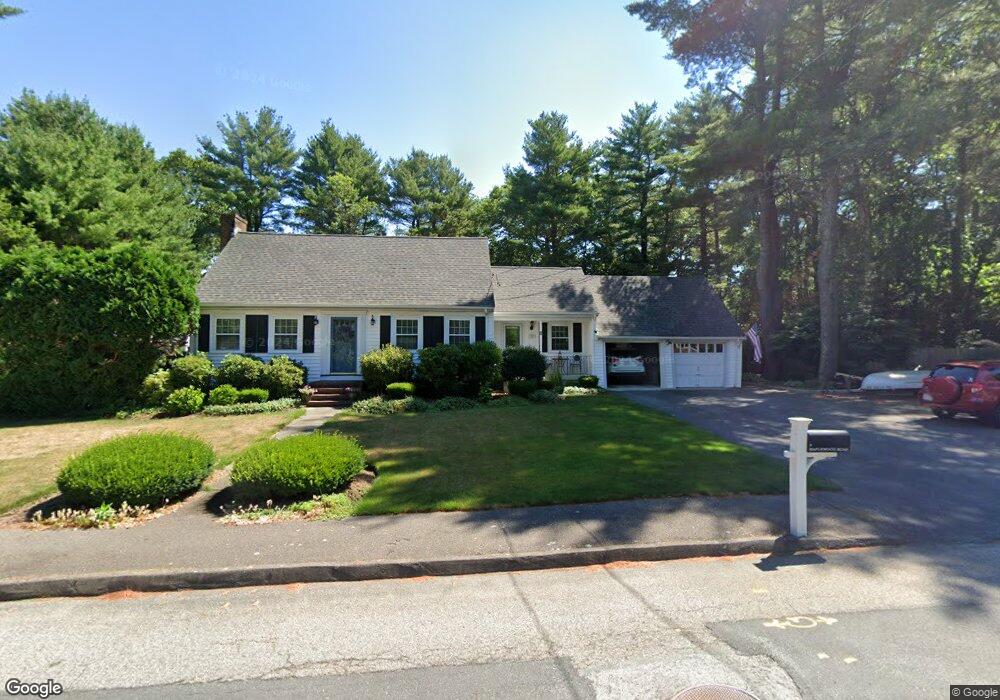
2 Maplewood Rd Medfield, MA 02052
Estimated Value: $899,000 - $1,128,000
4
Beds
3
Baths
1,980
Sq Ft
$507/Sq Ft
Est. Value
About This Home
This home is located at 2 Maplewood Rd, Medfield, MA 02052 and is currently estimated at $1,003,214, approximately $506 per square foot. 2 Maplewood Rd is a home located in Norfolk County with nearby schools including Memorial School, Ralph Wheelock School, and Dale Street School.
Ownership History
Date
Name
Owned For
Owner Type
Purchase Details
Closed on
Oct 28, 2005
Sold by
Christy Donald R and Christy Jane D
Bought by
Baum Joseph and Baum Susan E
Current Estimated Value
Home Financials for this Owner
Home Financials are based on the most recent Mortgage that was taken out on this home.
Original Mortgage
$434,000
Outstanding Balance
$231,315
Interest Rate
5.79%
Mortgage Type
Purchase Money Mortgage
Estimated Equity
$771,899
Create a Home Valuation Report for This Property
The Home Valuation Report is an in-depth analysis detailing your home's value as well as a comparison with similar homes in the area
Home Values in the Area
Average Home Value in this Area
Purchase History
| Date | Buyer | Sale Price | Title Company |
|---|---|---|---|
| Baum Joseph | $542,500 | -- | |
| Baum Joseph | $542,500 | -- |
Source: Public Records
Mortgage History
| Date | Status | Borrower | Loan Amount |
|---|---|---|---|
| Open | Baum Joseph | $434,000 | |
| Closed | Baum Joseph | $434,000 |
Source: Public Records
Tax History
| Year | Tax Paid | Tax Assessment Tax Assessment Total Assessment is a certain percentage of the fair market value that is determined by local assessors to be the total taxable value of land and additions on the property. | Land | Improvement |
|---|---|---|---|---|
| 2025 | $11,215 | $812,700 | $483,600 | $329,100 |
| 2024 | $10,936 | $747,000 | $436,200 | $310,800 |
| 2023 | $10,870 | $704,500 | $417,200 | $287,300 |
| 2022 | $10,597 | $608,300 | $398,200 | $210,100 |
| 2021 | $10,505 | $591,500 | $394,500 | $197,000 |
| 2020 | $10,432 | $585,100 | $392,600 | $192,500 |
| 2019 | $10,150 | $568,000 | $375,500 | $192,500 |
| 2018 | $9,341 | $548,500 | $365,200 | $183,300 |
| 2017 | $9,181 | $543,600 | $360,300 | $183,300 |
| 2016 | $8,502 | $507,600 | $324,300 | $183,300 |
| 2015 | $7,887 | $491,700 | $320,300 | $171,400 |
| 2014 | $7,622 | $472,800 | $301,400 | $171,400 |
Source: Public Records
Map
Nearby Homes
- 23 Winter St
- 5 Castle Ave
- 57 Colonial Rd
- 1 Chestnut Ln
- 17 Boyden Rd
- 345 North St
- 55 West St Unit 3
- 2 Lincoln Ct
- 17 Rolling Ln
- 40 Hearthstone Dr
- 14 Sunset Way Unit 14
- 80 Pleasant St
- 82 Pleasant St
- 29 Bridge St
- 91 Pleasant St Unit A6
- 89 Pleasant St Unit D1
- 8 Woodfall Rd
- 25 Longmeadow Rd
- 42 Maple Ln
- 16 Laurel Dr
Your Personal Tour Guide
Ask me questions while you tour the home.