Estimated Value: $316,672 - $356,000
3
Beds
3
Baths
1,731
Sq Ft
$196/Sq Ft
Est. Value
About This Home
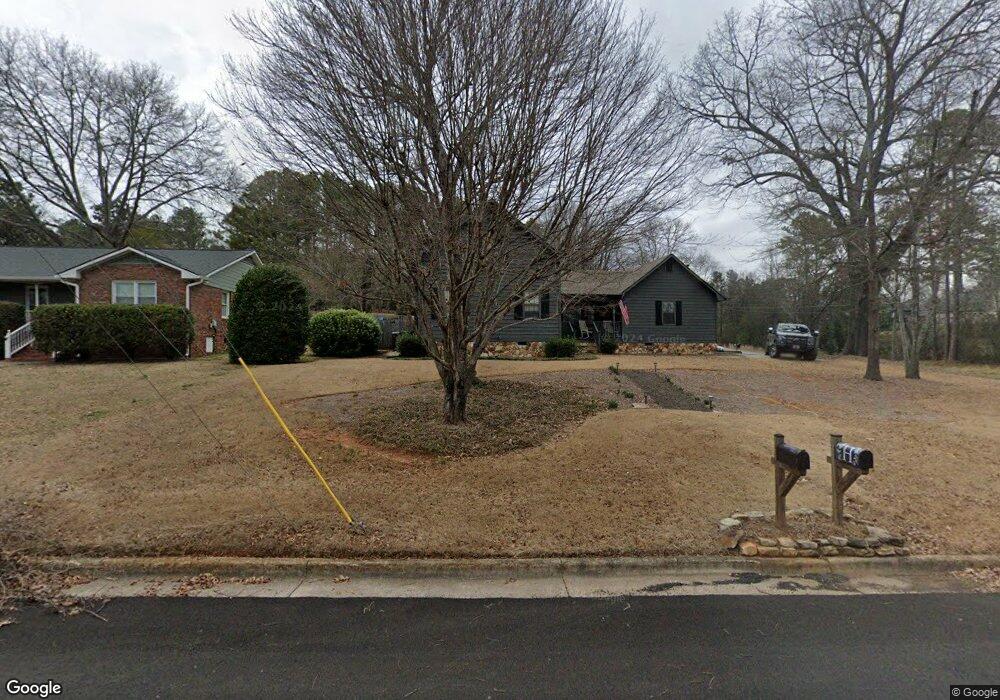
This home is located at 2 Maplewood Square SE, Rome, GA 30161 and is currently estimated at $338,418, approximately $195 per square foot. 2 Maplewood Square SE is a home located in Floyd County with nearby schools including Rome High School, St. Mary School, and Unity Christian School.
Ownership History
Date
Name
Owned For
Owner Type
Purchase Details
Closed on
Apr 12, 2021
Sold by
Cook Freda
Bought by
Helton Robert C and Helton April N
Current Estimated Value
Home Financials for this Owner
Home Financials are based on the most recent Mortgage that was taken out on this home.
Original Mortgage
$254,308
Outstanding Balance
$229,793
Interest Rate
3.05%
Mortgage Type
FHA
Estimated Equity
$108,625
Purchase Details
Closed on
Apr 7, 2006
Sold by
Not Provided
Bought by
Cook Freda
Home Financials for this Owner
Home Financials are based on the most recent Mortgage that was taken out on this home.
Original Mortgage
$155,854
Interest Rate
6.29%
Mortgage Type
FHA
Purchase Details
Closed on
Aug 10, 2004
Sold by
Mcbrayer Daniel J and Mcbrayer Sharon R
Bought by
Davis Chad D and Leslie Davis
Purchase Details
Closed on
Jul 26, 1988
Sold by
Hendrix Alvin C
Bought by
Mcbrayer Daniel J and Mcbrayer Sharon R
Purchase Details
Closed on
Apr 1, 1983
Sold by
Howell Adrain
Bought by
Hendrix Alvin C
Purchase Details
Closed on
Jul 1, 1971
Bought by
Howell Adrain
Create a Home Valuation Report for This Property
The Home Valuation Report is an in-depth analysis detailing your home's value as well as a comparison with similar homes in the area
Home Values in the Area
Average Home Value in this Area
Purchase History
| Date | Buyer | Sale Price | Title Company |
|---|---|---|---|
| Helton Robert C | $259,000 | -- | |
| Cook Freda | $158,300 | -- | |
| Davis Chad D | $149,900 | -- | |
| Mcbrayer Daniel J | $68,000 | -- | |
| Hendrix Alvin C | $6,500 | -- | |
| Howell Adrain | -- | -- |
Source: Public Records
Mortgage History
| Date | Status | Borrower | Loan Amount |
|---|---|---|---|
| Open | Helton Robert C | $254,308 | |
| Previous Owner | Cook Freda | $155,854 |
Source: Public Records
Tax History Compared to Growth
Tax History
| Year | Tax Paid | Tax Assessment Tax Assessment Total Assessment is a certain percentage of the fair market value that is determined by local assessors to be the total taxable value of land and additions on the property. | Land | Improvement |
|---|---|---|---|---|
| 2024 | $3,703 | $115,741 | $14,001 | $101,740 |
| 2023 | $3,672 | $111,990 | $12,688 | $99,302 |
| 2022 | $3,432 | $95,344 | $10,500 | $84,844 |
| 2021 | $2,460 | $70,954 | $10,500 | $60,454 |
| 2020 | $2,398 | $66,326 | $8,094 | $58,232 |
| 2019 | $2,320 | $63,968 | $8,094 | $55,874 |
| 2018 | $2,232 | $61,589 | $8,094 | $53,495 |
| 2017 | $2,193 | $60,517 | $8,094 | $52,423 |
| 2016 | $2,177 | $59,904 | $8,080 | $51,824 |
| 2015 | $2,075 | $60,664 | $8,080 | $52,584 |
| 2014 | $2,075 | $60,426 | $8,080 | $52,346 |
Source: Public Records
Map
Nearby Homes
- 26 Maplewood Square SE
- 22 Oakfield Dr SE
- 20 Mitchell Cir SE
- 100 Valley Brook Dr SE
- 4 Mitchell Cir SE
- 14 Laurchris Dr SE
- 9 Heather Rd SE
- 227 W Lakeshore Dr SE
- 0 Lakeshore Dr
- 120 Keown Rd SE
- 6 Woodland Dr SE
- 11 Surrey Trail SE
- 4 Coach Trail SE
- 15 Mimosa Dr SE
- 226 Maplecrest Ln SE
- 11 Breckenridge Rd SE
- 13 Breckenridge Rd SE
- 0 Georgia 293
- 8 Covey Rise Dr SE
- 4 Maplewood Square SE
- 9 Maplewood Square SE
- 10 Maplewood Square
- 11 Maplewood Square SE
- 410 Turner Chapel Rd SE
- 8 Maplewood Square SE
- 13 Maplewood Square SE
- 39 Maplewood Square SE
- 37 Maplewood Square SE
- 3 Shadowood Dr SE
- 2 Shadowood Dr SE
- 15 Maplewood Square SE
- 35 Maplewood Square SE
- 390 Turner Chapel Rd SE
- 33 Maplewood Square SE
- 402 Turner Chapel Rd SE
- 5 Shadowood Dr SE
- 4 Shadowood Dr SE
- 17 Maplewood Square SE
- 12 Maplewood Square SE