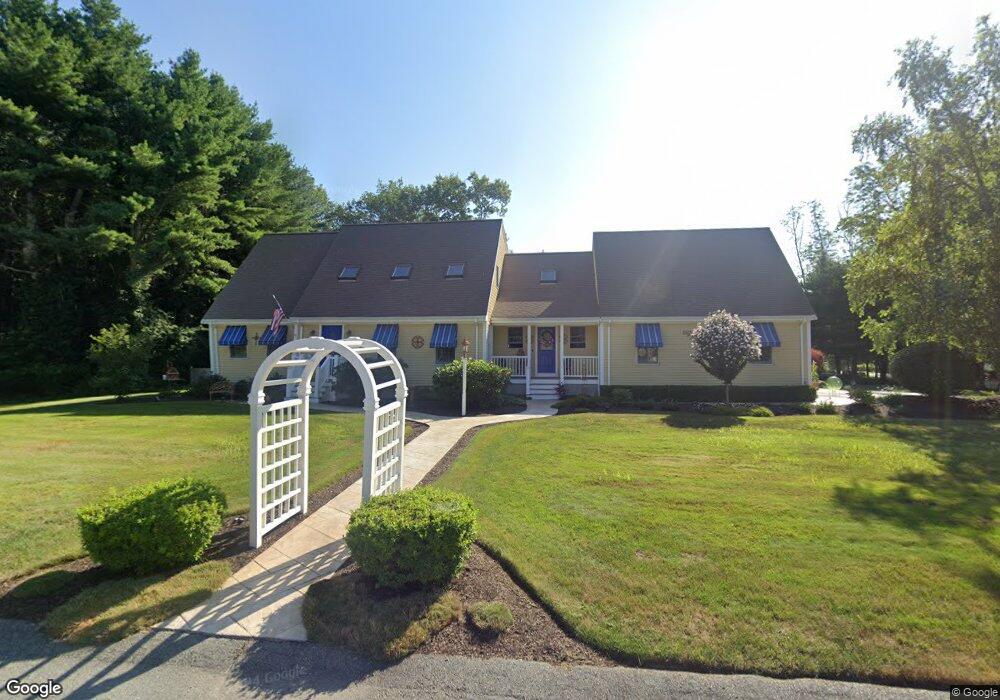
2 Margaret St Acushnet, MA 02743
Estimated Value: $728,000 - $767,000
3
Beds
3
Baths
2,587
Sq Ft
$288/Sq Ft
Est. Value
About This Home
This home is located at 2 Margaret St, Acushnet, MA 02743 and is currently estimated at $745,244, approximately $288 per square foot. 2 Margaret St is a home located in Bristol County with nearby schools including Acushnet Elementary School, Albert F Ford Middle School, and Alma Del Mar Charter School.
Ownership History
Date
Name
Owned For
Owner Type
Purchase Details
Closed on
Nov 21, 2024
Sold by
Maguire Robin A and Maguire Paul C
Bought by
Maguire Paul C and Maguire Robin A
Current Estimated Value
Purchase Details
Closed on
Mar 29, 2004
Sold by
Labonte Karyn L and Labonte Stephen A
Bought by
Maguire Paul C and Maguire Robin A
Create a Home Valuation Report for This Property
The Home Valuation Report is an in-depth analysis detailing your home's value as well as a comparison with similar homes in the area
Home Values in the Area
Average Home Value in this Area
Purchase History
| Date | Buyer | Sale Price | Title Company |
|---|---|---|---|
| Maguire Paul C | -- | None Available | |
| Maguire Paul C | -- | None Available | |
| Maguire Paul C | $448,500 | -- | |
| Maguire Paul C | $448,500 | -- |
Source: Public Records
Mortgage History
| Date | Status | Borrower | Loan Amount |
|---|---|---|---|
| Previous Owner | Maguire Paul C | $200,500 | |
| Previous Owner | Maguire Paul C | $196,000 |
Source: Public Records
Tax History Compared to Growth
Tax History
| Year | Tax Paid | Tax Assessment Tax Assessment Total Assessment is a certain percentage of the fair market value that is determined by local assessors to be the total taxable value of land and additions on the property. | Land | Improvement |
|---|---|---|---|---|
| 2025 | $6,951 | $644,200 | $174,100 | $470,100 |
| 2024 | $6,558 | $574,800 | $152,300 | $422,500 |
| 2023 | $6,659 | $554,900 | $138,700 | $416,200 |
| 2022 | $6,559 | $494,300 | $130,600 | $363,700 |
| 2021 | $2,067 | $438,300 | $130,600 | $307,700 |
| 2020 | $2,048 | $438,300 | $130,600 | $307,700 |
| 2019 | $5,971 | $421,100 | $130,600 | $290,500 |
| 2018 | $0 | $400,800 | $130,600 | $270,200 |
| 2017 | $5,603 | $388,000 | $130,600 | $257,400 |
| 2016 | $5,702 | $392,400 | $130,600 | $261,800 |
| 2015 | $5,236 | $366,700 | $130,600 | $236,100 |
Source: Public Records
Map
Nearby Homes