2 Mark St Natick, MA 01760
Estimated Value: $1,004,000 - $1,140,000
3
Beds
3
Baths
2,023
Sq Ft
$535/Sq Ft
Est. Value
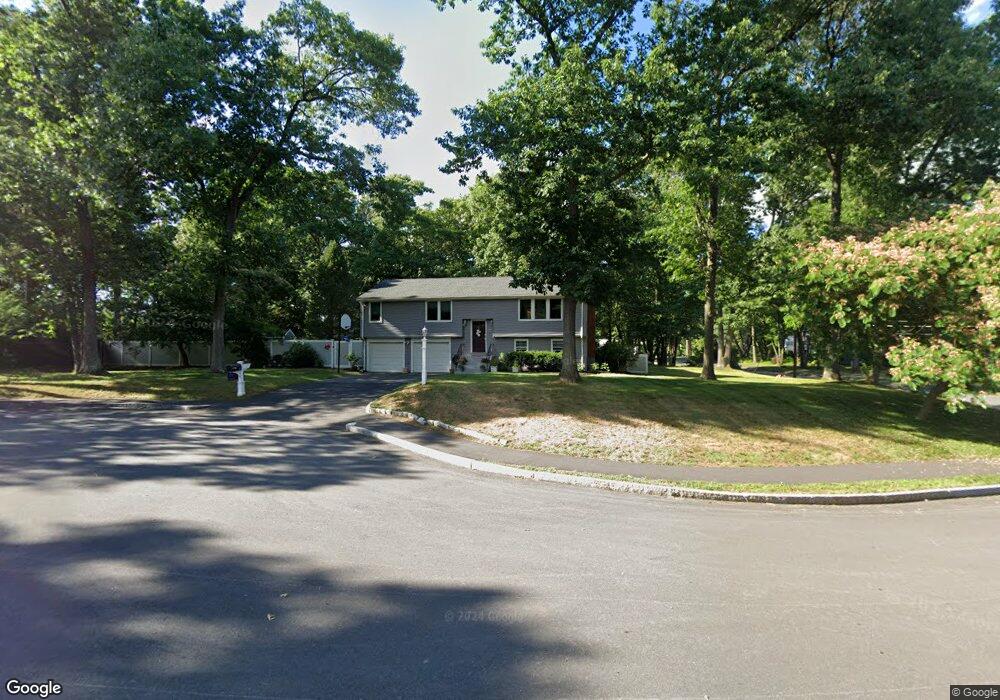
About This Home
This home is located at 2 Mark St, Natick, MA 01760 and is currently estimated at $1,082,379, approximately $535 per square foot. 2 Mark St is a home located in Middlesex County with nearby schools including Natick High School, Bennett-Hemenway (Ben-Hem) Elementary School, and Wilson Middle School.
Ownership History
Date
Name
Owned For
Owner Type
Purchase Details
Closed on
Jun 29, 2010
Sold by
Androphy Serena
Bought by
Sucar Chammas Joseph and Sucar Chammas Sylvie
Current Estimated Value
Home Financials for this Owner
Home Financials are based on the most recent Mortgage that was taken out on this home.
Original Mortgage
$403,200
Outstanding Balance
$271,391
Interest Rate
4.98%
Mortgage Type
Purchase Money Mortgage
Estimated Equity
$810,988
Purchase Details
Closed on
Nov 2, 2007
Sold by
Androphy Elliot and Androphy Serena
Bought by
Androphy Serena
Create a Home Valuation Report for This Property
The Home Valuation Report is an in-depth analysis detailing your home's value as well as a comparison with similar homes in the area
Home Values in the Area
Average Home Value in this Area
Purchase History
| Date | Buyer | Sale Price | Title Company |
|---|---|---|---|
| Sucar Chammas Joseph | $504,000 | -- | |
| Androphy Serena | -- | -- |
Source: Public Records
Mortgage History
| Date | Status | Borrower | Loan Amount |
|---|---|---|---|
| Open | Sucar Chammas Joseph | $403,200 |
Source: Public Records
Tax History
| Year | Tax Paid | Tax Assessment Tax Assessment Total Assessment is a certain percentage of the fair market value that is determined by local assessors to be the total taxable value of land and additions on the property. | Land | Improvement |
|---|---|---|---|---|
| 2025 | $10,991 | $919,000 | $476,100 | $442,900 |
| 2024 | $10,620 | $866,200 | $449,700 | $416,500 |
| 2023 | $10,361 | $819,700 | $420,900 | $398,800 |
| 2022 | $10,005 | $750,000 | $382,000 | $368,000 |
| 2021 | $9,586 | $704,300 | $361,000 | $343,300 |
| 2020 | $9,372 | $688,600 | $345,300 | $343,300 |
| 2019 | $8,752 | $688,600 | $345,300 | $343,300 |
| 2018 | $8,557 | $655,700 | $313,900 | $341,800 |
| 2017 | $8,338 | $618,100 | $282,400 | $335,700 |
| 2016 | $8,142 | $600,000 | $267,400 | $332,600 |
| 2015 | $7,905 | $572,000 | $267,400 | $304,600 |
Source: Public Records
Map
Nearby Homes
- 14 Drury Ln
- 8 Liberty St
- 29 Irving Rd
- 5 Bradford Rd
- 4 Richard Rd
- 1 Richard Rd
- 25 Irving Rd
- 48 Wethersfield Rd
- 50 Wethersfield Rd
- 340 N Main St
- 278 N Main St
- 6 Cypress Rd
- 136 Commonwealth Rd
- 37 Longfellow Rd
- 6 Ash St
- 8 Arlington Cir
- 201 Willow Brook Dr
- 26 Longfellow Rd
- 45 W Plain St Unit 1
- 186 Main St
Your Personal Tour Guide
Ask me questions while you tour the home.