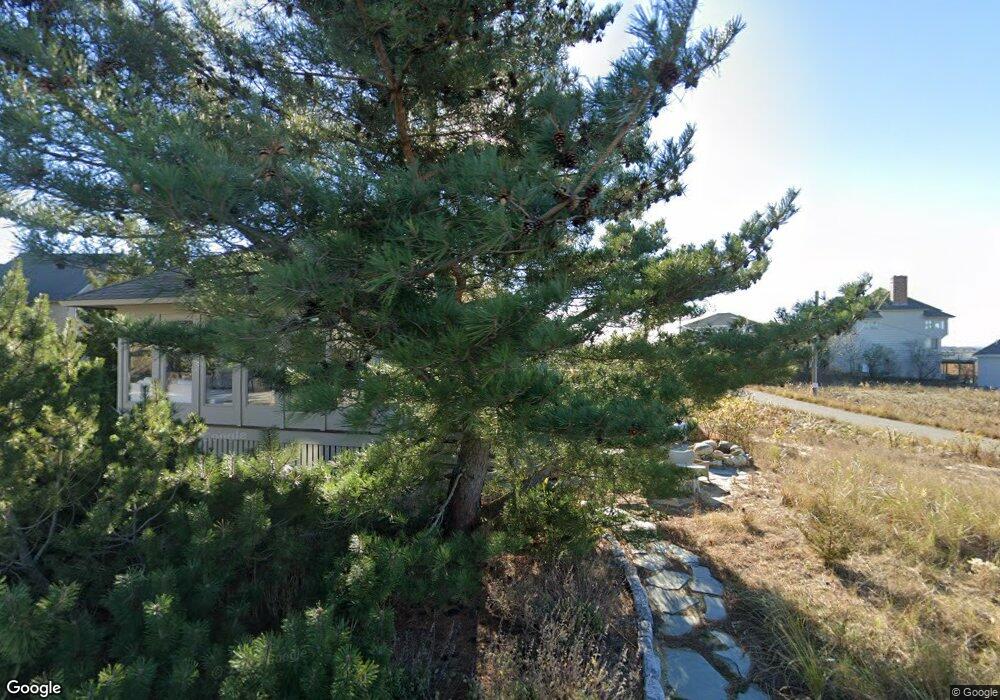
2 Marsh St Newburyport, MA 01950
Estimated Value: $1,199,000 - $1,643,000
3
Beds
2
Baths
1,914
Sq Ft
$769/Sq Ft
Est. Value
About This Home
This home is located at 2 Marsh St, Newburyport, MA 01950 and is currently estimated at $1,472,668, approximately $769 per square foot. 2 Marsh St is a home located in Essex County with nearby schools including Francis T. Bresnahan Elementary School, Edward G. Molin Elementary School, and Rupert A. Nock Middle School.
Ownership History
Date
Name
Owned For
Owner Type
Purchase Details
Closed on
Feb 16, 2007
Sold by
Murphy Brett P
Bought by
Murphy Brett P
Current Estimated Value
Purchase Details
Closed on
Sep 21, 2000
Sold by
Est Brewer Irving L and Brewer Marjorie A
Bought by
Murphy Brett P and Murphy Shawn M
Create a Home Valuation Report for This Property
The Home Valuation Report is an in-depth analysis detailing your home's value as well as a comparison with similar homes in the area
Home Values in the Area
Average Home Value in this Area
Purchase History
| Date | Buyer | Sale Price | Title Company |
|---|---|---|---|
| Murphy Brett P | -- | -- | |
| Murphy Brett P | $85,000 | -- |
Source: Public Records
Mortgage History
| Date | Status | Borrower | Loan Amount |
|---|---|---|---|
| Open | Murphy Brett P | $205,000 | |
| Previous Owner | Murphy Brett P | $116,000 | |
| Previous Owner | Murphy Brett P | $15,000 |
Source: Public Records
Tax History Compared to Growth
Tax History
| Year | Tax Paid | Tax Assessment Tax Assessment Total Assessment is a certain percentage of the fair market value that is determined by local assessors to be the total taxable value of land and additions on the property. | Land | Improvement |
|---|---|---|---|---|
| 2025 | $13,614 | $1,421,100 | $781,200 | $639,900 |
| 2024 | $12,815 | $1,285,400 | $673,700 | $611,700 |
| 2023 | $11,538 | $1,074,300 | $570,000 | $504,300 |
| 2022 | $10,765 | $896,300 | $475,000 | $421,300 |
| 2021 | $10,352 | $819,000 | $431,800 | $387,200 |
| 2020 | $10,516 | $819,000 | $431,800 | $387,200 |
| 2019 | $10,753 | $822,100 | $431,800 | $390,300 |
| 2018 | $10,514 | $792,900 | $411,400 | $381,500 |
| 2017 | $10,401 | $773,300 | $391,800 | $381,500 |
| 2016 | $8,958 | $669,000 | $383,500 | $285,500 |
| 2015 | $8,924 | $669,000 | $383,500 | $285,500 |
Source: Public Records
Map
Nearby Homes
- 163 Old Point Rd
- 7 Davoli Way
- 5 Harbor St
- 11 Harbor St
- 4 54th St
- 12 Barker St
- 10 61st St Unit 10
- 12 63rd St
- 12 53rd St
- 11 71st St
- 28 & 30 Plum Island Turnpike
- 11 Sunset Dr
- 65 Plum Island Turnpike
- 2 Sunset Dr
- 10 Meadowview Ln Unit B
- 14 Fordham Way
- 3 Riverview Dr
- 42 Riverview Dr
- 4 Goodwin Ave
- 1 Lancaster Rd