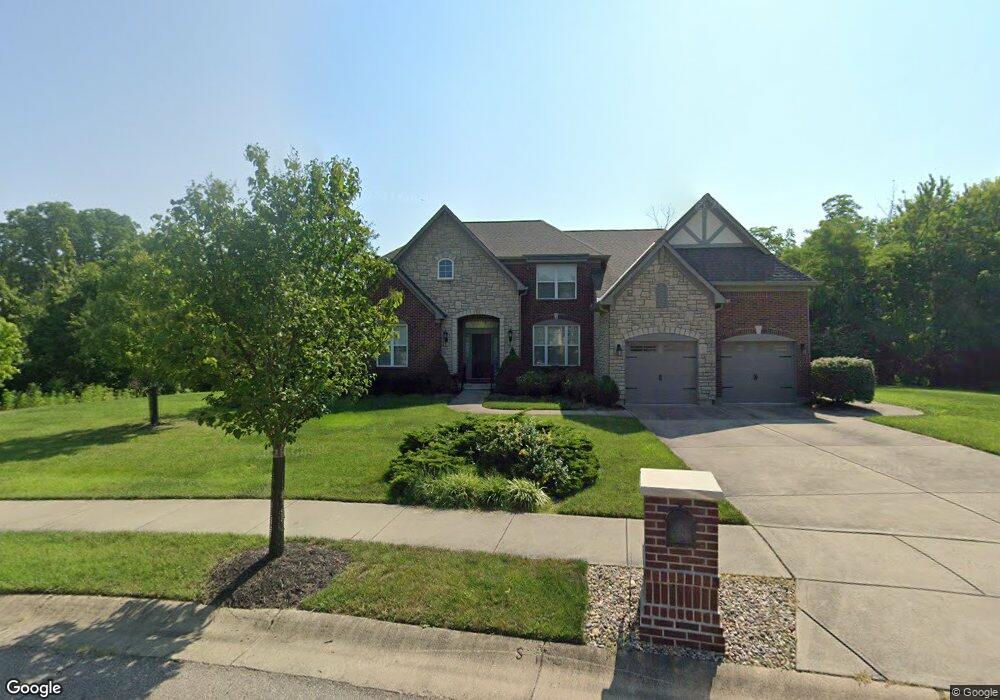
2 Matthews Ct Unit Lot 2 Glendale, OH 45246
Estimated Value: $782,000 - $818,000
4
Beds
4
Baths
3,618
Sq Ft
$222/Sq Ft
Est. Value
About This Home
This home is located at 2 Matthews Ct Unit Lot 2, Glendale, OH 45246 and is currently estimated at $804,603, approximately $222 per square foot. 2 Matthews Ct Unit Lot 2 is a home located in Hamilton County with nearby schools including Glendale Elementary School, Princeton Community Middle School, and Princeton High School.
Ownership History
Date
Name
Owned For
Owner Type
Purchase Details
Closed on
Jul 29, 2020
Sold by
Zeno Thomas E and Bruggeman Linda
Bought by
Zeno Thomas E and Bruggeman Linda S
Current Estimated Value
Purchase Details
Closed on
May 15, 2012
Sold by
Drees Premier Homes Inc
Bought by
Zeno Thomas E and Bruggeman Linda
Home Financials for this Owner
Home Financials are based on the most recent Mortgage that was taken out on this home.
Original Mortgage
$330,000
Outstanding Balance
$46,846
Interest Rate
3.89%
Mortgage Type
New Conventional
Estimated Equity
$757,757
Purchase Details
Closed on
Nov 16, 2011
Sold by
Zeno Thomas E and Bruggeman Linda
Bought by
Drees Premier Homes Inc
Purchase Details
Closed on
Jan 31, 2007
Sold by
Matthews Court Llc
Bought by
Zeno Thomas E and Bruggeman Linda
Create a Home Valuation Report for This Property
The Home Valuation Report is an in-depth analysis detailing your home's value as well as a comparison with similar homes in the area
Home Values in the Area
Average Home Value in this Area
Purchase History
| Date | Buyer | Sale Price | Title Company |
|---|---|---|---|
| Zeno Thomas E | -- | None Available | |
| Zeno Thomas E | $562,088 | Terry Monnie Title | |
| Drees Premier Homes Inc | -- | Attorney | |
| Zeno Thomas E | $129,000 | Attorney | |
| Matthews Court Llc | -- | Attorney |
Source: Public Records
Mortgage History
| Date | Status | Borrower | Loan Amount |
|---|---|---|---|
| Open | Zeno Thomas E | $330,000 |
Source: Public Records
Tax History Compared to Growth
Tax History
| Year | Tax Paid | Tax Assessment Tax Assessment Total Assessment is a certain percentage of the fair market value that is determined by local assessors to be the total taxable value of land and additions on the property. | Land | Improvement |
|---|---|---|---|---|
| 2024 | $13,196 | $232,005 | $34,125 | $197,880 |
| 2023 | $13,284 | $232,005 | $34,125 | $197,880 |
| 2022 | $13,962 | $211,761 | $26,226 | $185,535 |
| 2021 | $14,193 | $211,761 | $26,226 | $185,535 |
| 2020 | $14,193 | $211,761 | $26,226 | $185,535 |
| 2019 | $13,822 | $190,775 | $23,625 | $167,150 |
| 2018 | $13,185 | $190,775 | $23,625 | $167,150 |
| 2017 | $12,507 | $190,775 | $23,625 | $167,150 |
| 2016 | $12,948 | $196,732 | $22,785 | $173,947 |
| 2015 | $13,086 | $196,732 | $22,785 | $173,947 |
| 2014 | $13,115 | $196,732 | $22,785 | $173,947 |
| 2013 | $12,937 | $196,732 | $24,500 | $172,232 |
Source: Public Records
Map
Nearby Homes
- 103 W Sharon Rd
- 163 Washington Ave
- 958 Summit Ave
- 200 W Sharon Rd
- 820 van Nes Dr
- 156 Sheffield Rd
- 237 Eastwick Dr
- 275 Bennington Way
- 256 Centerbury Ct Unit 67
- 304 Cleveland Ave
- 725 Woodbine Ave
- 278 Centerbury Ct
- 185 Magnolia Ave
- 311 E Willow Ave
- 11740 Van Camp Ln
- 11760 Van Camp Ln
- 33 Creekwood Square
- 162 Sheffield Rd
- 11839 Mangrove Ln
- 484 W Kemper Rd
- 4 Matthews Ct Unit Lot 4
- 0 Matthews Ct Unit Lot 3 921077
- 75 Washington Ave
- 20 Matthews Ct Unit 20
- 5 Matthews Ct
- 87 Washington Ave
- 1 Matthews Ct Unit Lot
- 10 Matthews Ct
- 83 Washington Ave
- 79 Washington Ave
- 12 Matthews Ct
- 7 Matthews Ct
- 71 Washington Ave
- 67 Washington Ave
- 9 Matthews Ct
- 99 Washington Ave
- 63 Washington Ave
- 14 Matthews Ct
- 103 Washington Ave
- 59 Washington Ave