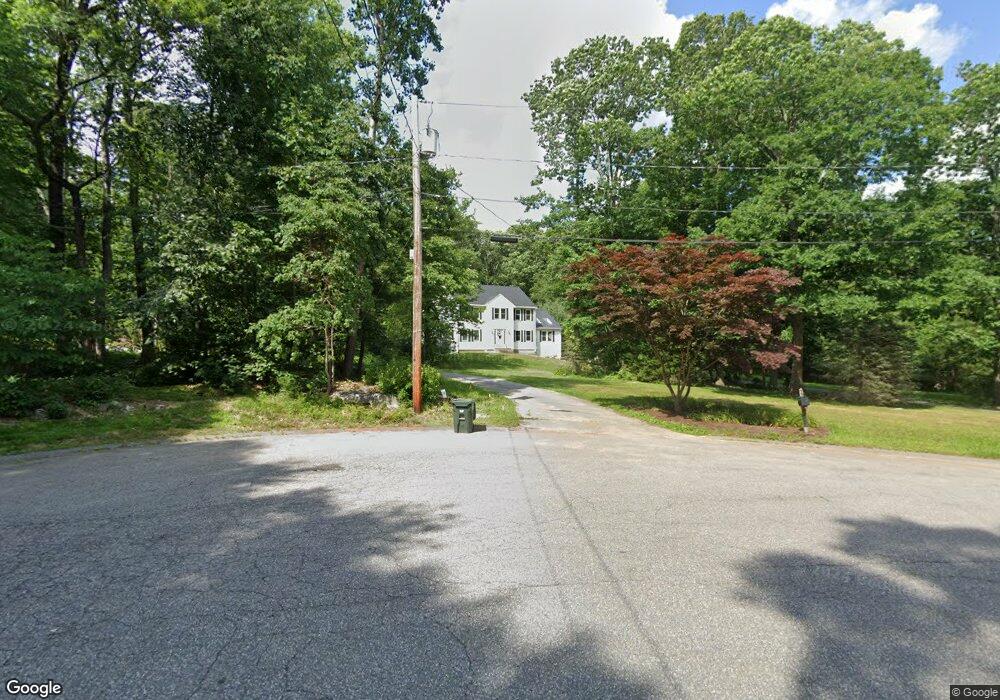
2 Mckay Rd Hopkinton, MA 01748
Estimated Value: $1,050,000 - $1,193,000
4
Beds
3
Baths
2,348
Sq Ft
$484/Sq Ft
Est. Value
About This Home
This home is located at 2 Mckay Rd, Hopkinton, MA 01748 and is currently estimated at $1,135,298, approximately $483 per square foot. 2 Mckay Rd is a home located in Middlesex County with nearby schools including Marathon Elementary School, Hopkins Elementary School, and Elmwood Elementary School.
Ownership History
Date
Name
Owned For
Owner Type
Purchase Details
Closed on
Mar 26, 2002
Sold by
Gatzogiannis George and Gatzogiannis Viktoria
Bought by
Sanborn Randall M
Current Estimated Value
Home Financials for this Owner
Home Financials are based on the most recent Mortgage that was taken out on this home.
Original Mortgage
$300,700
Outstanding Balance
$125,543
Interest Rate
6.91%
Mortgage Type
Purchase Money Mortgage
Estimated Equity
$1,009,755
Create a Home Valuation Report for This Property
The Home Valuation Report is an in-depth analysis detailing your home's value as well as a comparison with similar homes in the area
Home Values in the Area
Average Home Value in this Area
Purchase History
| Date | Buyer | Sale Price | Title Company |
|---|---|---|---|
| Sanborn Randall M | $440,000 | -- |
Source: Public Records
Mortgage History
| Date | Status | Borrower | Loan Amount |
|---|---|---|---|
| Open | Sanborn Randall M | $300,700 |
Source: Public Records
Tax History Compared to Growth
Tax History
| Year | Tax Paid | Tax Assessment Tax Assessment Total Assessment is a certain percentage of the fair market value that is determined by local assessors to be the total taxable value of land and additions on the property. | Land | Improvement |
|---|---|---|---|---|
| 2025 | $11,574 | $816,200 | $325,500 | $490,700 |
| 2024 | $11,426 | $782,100 | $310,700 | $471,400 |
| 2023 | $11,184 | $707,400 | $275,000 | $432,400 |
| 2022 | $11,029 | $647,600 | $251,400 | $396,200 |
| 2021 | $10,726 | $628,000 | $244,500 | $383,500 |
| 2020 | $9,968 | $592,600 | $239,200 | $353,400 |
| 2019 | $9,406 | $547,800 | $227,500 | $320,300 |
| 2018 | $8,945 | $529,300 | $217,000 | $312,300 |
| 2017 | $8,694 | $517,500 | $211,100 | $306,400 |
| 2016 | $8,592 | $504,500 | $207,000 | $297,500 |
| 2015 | $8,628 | $480,400 | $201,400 | $279,000 |
Source: Public Records
Map
Nearby Homes
- 11 Kimball Rd
- 180 Ash St
- 5 Myrtle Ave Unit 2
- 7 Myrtle Ave Unit 3
- 20 Davenport Ln Unit 20
- 13 Fitch Ave
- 13 Fitch Ave Unit 19
- 16 Fitch Ave Unit 6
- 11 Fitch Ave Unit 18
- 10 Oak St
- 7 Davenport Ln Unit 7
- 14 Fitch Ave Unit 7
- 12 Fitch Ave Unit 8
- 10 Fitch Ave Unit 9
- Stockbridge Plan at Newbury Glen
- Williamstown Plan at Newbury Glen
- Silverbrook Plan at Newbury Glen
- Dickinson Plan at Newbury Glen
- Copley Plan at Newbury Glen
- 3 Fitch Ave Unit 14
- 25 Thayer Heights Rd
- 4 Mckay Rd
- 23 Thayer Heights Rd
- 27 Thayer Heights Rd
- 5 Mckay Rd
- 1 Mckay Rd
- 3 Mckay Rd
- 47 Chestnut St
- 49 Chestnut St
- 51 Chestnut St
- 41 Chestnut St
- 20 Briarcliff Dr
- 20 Thayer Heights Rd
- 18 Briarcliff Dr
- 21 Thayer Heights Rd
- 22 Thayer Heights Rd
- 40 Chestnut St
- 24 Thayer Heights Rd
- 38 Chestnut St
- 16 Briarcliff Dr