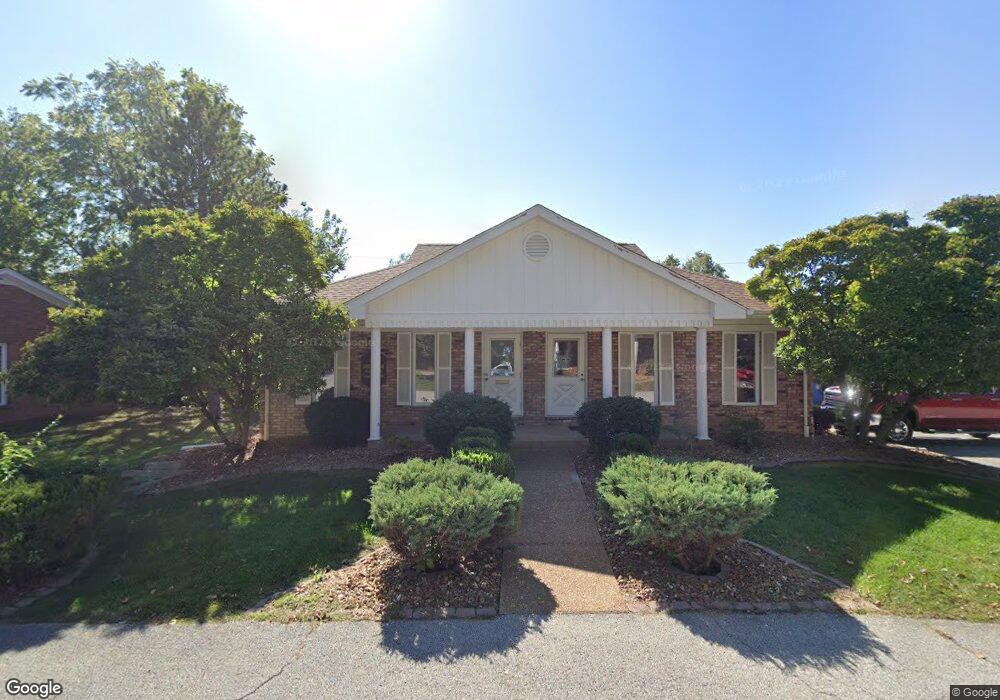
2 Meadow Heights Prof Park Collinsville, IL 62234
Estimated Value: $220,048
--
Bed
--
Bath
1,200
Sq Ft
$183/Sq Ft
Est. Value
About This Home
This home is located at 2 Meadow Heights Prof Park, Collinsville, IL 62234 and is currently estimated at $220,048, approximately $183 per square foot. 2 Meadow Heights Prof Park is a home located in Madison County with nearby schools including John A Renfro Elementary School, Dorris Intermediate School, and Collinsville Middle School.
Ownership History
Date
Name
Owned For
Owner Type
Purchase Details
Closed on
Dec 19, 2016
Sold by
Lklk Management Llc and Stoner Kenneth C
Bought by
Lindow Properties Llc
Current Estimated Value
Purchase Details
Closed on
Jan 11, 2008
Sold by
Giacoletto Tina
Bought by
Lklk Management Llc
Home Financials for this Owner
Home Financials are based on the most recent Mortgage that was taken out on this home.
Original Mortgage
$102,500
Interest Rate
7.5%
Mortgage Type
Commercial
Purchase Details
Closed on
Feb 13, 2006
Sold by
Sherbut & Associates Inc
Bought by
Giacoletto Tina and Meadow Heights Professional Park Land Tr
Home Financials for this Owner
Home Financials are based on the most recent Mortgage that was taken out on this home.
Original Mortgage
$104,000
Interest Rate
6.95%
Mortgage Type
Commercial
Create a Home Valuation Report for This Property
The Home Valuation Report is an in-depth analysis detailing your home's value as well as a comparison with similar homes in the area
Home Values in the Area
Average Home Value in this Area
Purchase History
| Date | Buyer | Sale Price | Title Company |
|---|---|---|---|
| Lindow Properties Llc | $125,000 | Abstracts & Title | |
| Lklk Management Llc | $132,500 | Abstracts & Titles Inc | |
| Giacoletto Tina | $125,000 | Abstracts & Titles Inc |
Source: Public Records
Mortgage History
| Date | Status | Borrower | Loan Amount |
|---|---|---|---|
| Previous Owner | Lklk Management Llc | $102,500 | |
| Previous Owner | Giacoletto Tina | $104,000 |
Source: Public Records
Tax History Compared to Growth
Tax History
| Year | Tax Paid | Tax Assessment Tax Assessment Total Assessment is a certain percentage of the fair market value that is determined by local assessors to be the total taxable value of land and additions on the property. | Land | Improvement |
|---|---|---|---|---|
| 2024 | $3,936 | $61,570 | $17,330 | $44,240 |
| 2023 | $3,936 | $56,990 | $16,040 | $40,950 |
| 2022 | $3,751 | $51,240 | $14,350 | $36,890 |
| 2021 | $3,325 | $48,140 | $13,480 | $34,660 |
| 2020 | $3,206 | $45,930 | $12,860 | $33,070 |
| 2019 | $3,121 | $44,360 | $12,420 | $31,940 |
| 2018 | $3,087 | $42,510 | $11,760 | $30,750 |
| 2017 | $3,092 | $41,670 | $11,530 | $30,140 |
| 2016 | $4,049 | $51,810 | $11,530 | $40,280 |
| 2015 | $3,777 | $50,460 | $11,230 | $39,230 |
| 2014 | $3,777 | $50,460 | $11,230 | $39,230 |
| 2013 | $3,777 | $50,460 | $11,230 | $39,230 |
Source: Public Records
Map
Nearby Homes
- 706 Illinois Ave
- 1227 Ridge Ave
- 203 Greenfield Dr
- 102 Toni Ct
- 1210 Constance St
- 1120 Williams St
- 0 N Keebler Ave
- 1002 California Ave
- 892 Lester Ave
- 300 Pine Lake Rd Unit 6
- 300 Pine Lake Rd Unit 7
- 308 Brown Ave
- 501 Spring
- 1224 Cedar Ridge Ct
- 1322 Leland St
- 2 Chelsea Rd
- 919 Vine St
- 617 N Morrison Ave
- 921 Prospect St
- 414 Bunker Hill Dr
- 2 Meadow Heights Professional Park
- 5 Meadow Heights Professional Park
- 402 Meadow Ln
- 6 Meadow Heights Professional Park
- 400 Meadow Ln
- 1400 Franklin Ave
- 1402 Franklin Ave
- 1404 Franklin Ave
- 1366 Franklin Ave
- 8 Gail St
- 6 Gail St
- 401 Meadow Ln
- 1364 Franklin Ave
- 1406 Franklin Ave
- 1358 Franklin Ave
- 1401 Franklin Ave
- 403 Meadow Ln
- 405 Meadow Ln
- 1360 Franklin Ave
- 1403 Franklin Ave