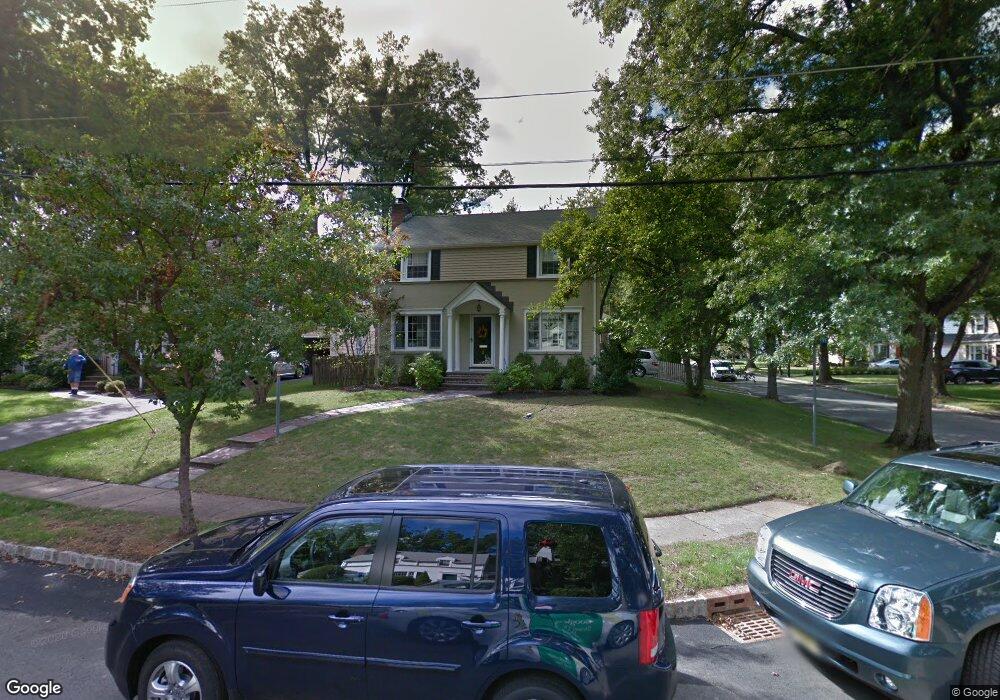
2 Mercer Ave Chatham, NJ 07928
Estimated Value: $1,202,000 - $1,465,000
Studio
--
Bath
2,040
Sq Ft
$670/Sq Ft
Est. Value
About This Home
This home is located at 2 Mercer Ave, Chatham, NJ 07928 and is currently estimated at $1,367,762, approximately $670 per square foot. 2 Mercer Ave is a home located in Morris County with nearby schools including Chatham High School, St. Patrick School, and ECLC of New Jersey.
Ownership History
Date
Name
Owned For
Owner Type
Purchase Details
Closed on
Jun 11, 2003
Sold by
Carroll Margaret
Bought by
Raunick Brian and Raunick Jennifer
Current Estimated Value
Purchase Details
Closed on
Aug 31, 1998
Sold by
Fahy Elmore R
Bought by
Carroll Terence H and Carroll Margaret Oneill
Home Financials for this Owner
Home Financials are based on the most recent Mortgage that was taken out on this home.
Original Mortgage
$210,000
Interest Rate
6.5%
Create a Home Valuation Report for This Property
The Home Valuation Report is an in-depth analysis detailing your home's value as well as a comparison with similar homes in the area
Home Values in the Area
Average Home Value in this Area
Purchase History
| Date | Buyer | Sale Price | Title Company |
|---|---|---|---|
| Raunick Brian | $595,000 | -- | |
| Carroll Terence H | $337,000 | Chicago Title Insurance Co |
Source: Public Records
Mortgage History
| Date | Status | Borrower | Loan Amount |
|---|---|---|---|
| Previous Owner | Carroll Terence H | $210,000 |
Source: Public Records
Tax History
| Year | Tax Paid | Tax Assessment Tax Assessment Total Assessment is a certain percentage of the fair market value that is determined by local assessors to be the total taxable value of land and additions on the property. | Land | Improvement |
|---|---|---|---|---|
| 2025 | $17,102 | $1,056,300 | $738,800 | $317,500 |
| 2024 | $16,415 | $1,056,300 | $738,800 | $317,500 |
Source: Public Records
Map
Nearby Homes
- 30 Edgewood Rd
- 15 Walnut St
- 85 Kings Rd
- 82 Washington Ave
- 28 Falmouth Rd
- 166 Washington Ave
- 128 Fairmount Ave
- 44 Brooklake Rd
- 6 Edgehill Ave
- 102 Watchung Ave
- 3 Fuller Ave
- 4 Delbarton Dr
- 15 N Hillside Ave
- 9 N Hillside Ave
- 62 Weston Ave
- 26 Pihlman Place
- 91 Woodland Rd
- 210 Kings Rd
- 81 Summit Ave
- 25 Beverly Rd
Your Personal Tour Guide
Ask me questions while you tour the home.