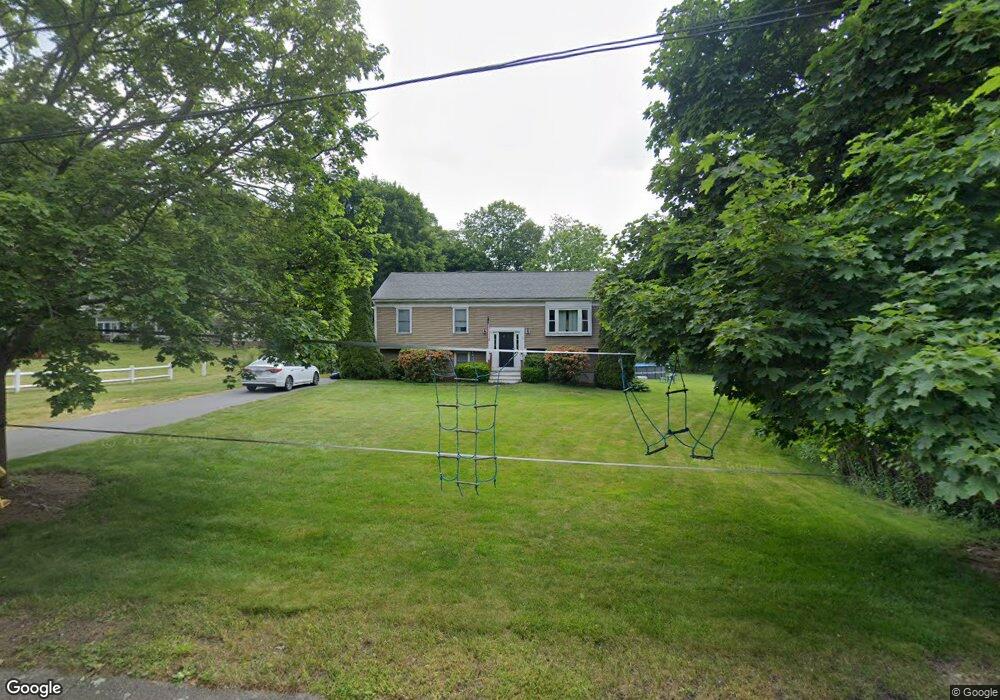
2 Michelle Way East Bridgewater, MA 02333
Estimated Value: $529,000 - $560,389
3
Beds
1
Bath
1,144
Sq Ft
$471/Sq Ft
Est. Value
About This Home
This home is located at 2 Michelle Way, East Bridgewater, MA 02333 and is currently estimated at $539,097, approximately $471 per square foot. 2 Michelle Way is a home located in Plymouth County with nearby schools including Gordon W Mitchell Middle School, East Bridgewater Jr./Sr. High School, and New Heights Charter School.
Ownership History
Date
Name
Owned For
Owner Type
Purchase Details
Closed on
Feb 3, 1997
Sold by
Madden John L
Bought by
Piers Vernon C and Piers Rhonda T
Current Estimated Value
Home Financials for this Owner
Home Financials are based on the most recent Mortgage that was taken out on this home.
Original Mortgage
$120,000
Interest Rate
7.65%
Mortgage Type
Purchase Money Mortgage
Create a Home Valuation Report for This Property
The Home Valuation Report is an in-depth analysis detailing your home's value as well as a comparison with similar homes in the area
Home Values in the Area
Average Home Value in this Area
Purchase History
| Date | Buyer | Sale Price | Title Company |
|---|---|---|---|
| Piers Vernon C | $142,400 | -- |
Source: Public Records
Mortgage History
| Date | Status | Borrower | Loan Amount |
|---|---|---|---|
| Open | Piers Vernon C | $235,000 | |
| Closed | Piers Vernon C | $50,000 | |
| Closed | Piers Vernon C | $156,500 | |
| Closed | Piers Vernon C | $120,000 |
Source: Public Records
Tax History Compared to Growth
Tax History
| Year | Tax Paid | Tax Assessment Tax Assessment Total Assessment is a certain percentage of the fair market value that is determined by local assessors to be the total taxable value of land and additions on the property. | Land | Improvement |
|---|---|---|---|---|
| 2025 | $6,408 | $468,800 | $177,100 | $291,700 |
| 2024 | $6,240 | $450,900 | $170,300 | $280,600 |
| 2023 | $6,157 | $426,100 | $170,300 | $255,800 |
| 2022 | $5,809 | $372,400 | $154,900 | $217,500 |
| 2021 | $5,567 | $326,500 | $148,800 | $177,700 |
| 2020 | $5,467 | $316,200 | $143,100 | $173,100 |
| 2019 | $5,298 | $301,700 | $136,800 | $164,900 |
| 2018 | $5,199 | $289,500 | $136,800 | $152,700 |
| 2017 | $5,084 | $277,800 | $130,500 | $147,300 |
| 2016 | $4,936 | $271,800 | $130,400 | $141,400 |
| 2015 | $4,847 | $272,900 | $129,500 | $143,400 |
| 2014 | $4,679 | $269,400 | $126,800 | $142,600 |
Source: Public Records
Map
Nearby Homes
- 4 Michelle Way
- 84 Matfield St
- 485 Matfield St
- 76 Matfield St
- 00 Thayer Ave
- 29 Waterman St
- 6 Michelle Way
- 15 Thayer Ave
- 17 Thayer Ave
- 474 Matfield St
- 19 Thayer Ave
- 471 Matfield St
- 470 Matfield St
- 470 Matfield St
- 36 Thayer Ave
- 467 Matfield St
- 24 Shawnee Ave
- 49 Waterman St
- 466 Matfield St
- 50 Waterman St