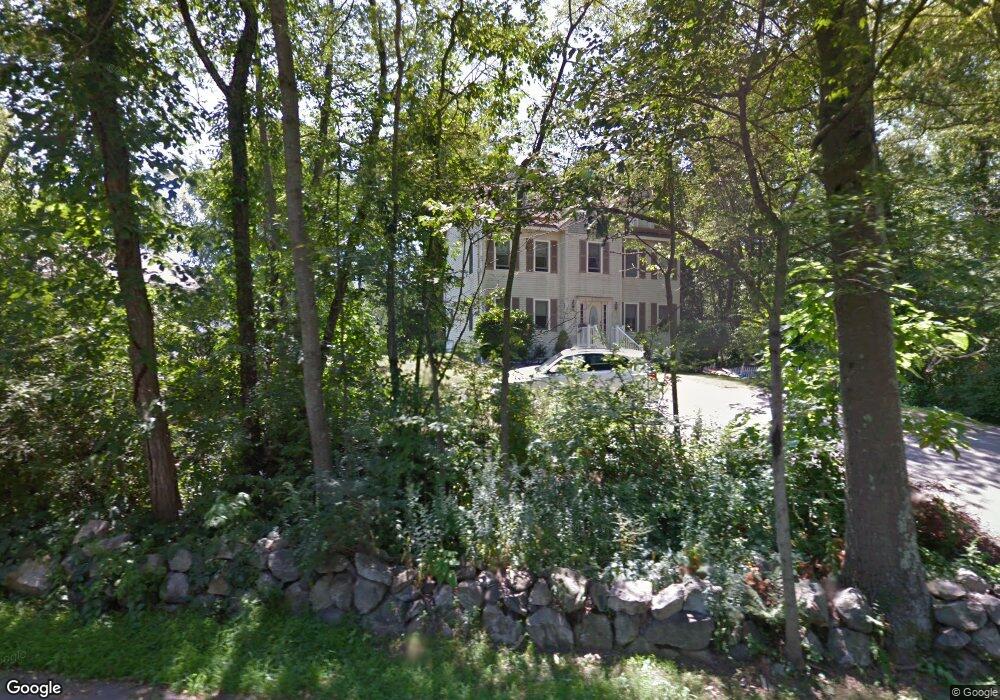
2 Mill St Georgetown, MA 01833
Estimated Value: $701,000 - $951,000
3
Beds
3
Baths
2,005
Sq Ft
$395/Sq Ft
Est. Value
About This Home
This home is located at 2 Mill St, Georgetown, MA 01833 and is currently estimated at $792,353, approximately $395 per square foot. 2 Mill St is a home located in Essex County with nearby schools including Perley Elementary School, Penn Brook School, and Georgetown High School.
Ownership History
Date
Name
Owned For
Owner Type
Purchase Details
Closed on
Jan 31, 2002
Sold by
Fennessey John F and Fennessey Gail L
Bought by
Donoghue Patrick J and Donoghue Maura R
Current Estimated Value
Purchase Details
Closed on
Dec 17, 1998
Sold by
Repucci Ruth S
Bought by
Fennessey John F and Fennessey Gail L
Purchase Details
Closed on
Aug 7, 1998
Sold by
Hamilton Mary Ann
Bought by
Repucci Ruth S
Create a Home Valuation Report for This Property
The Home Valuation Report is an in-depth analysis detailing your home's value as well as a comparison with similar homes in the area
Home Values in the Area
Average Home Value in this Area
Purchase History
| Date | Buyer | Sale Price | Title Company |
|---|---|---|---|
| Donoghue Patrick J | $400,000 | -- | |
| Fennessey John F | $280,000 | -- | |
| Repucci Ruth S | $105,000 | -- |
Source: Public Records
Mortgage History
| Date | Status | Borrower | Loan Amount |
|---|---|---|---|
| Open | Repucci Ruth S | $274,500 | |
| Closed | Repucci Ruth S | $115,000 | |
| Closed | Repucci Ruth S | $315,700 |
Source: Public Records
Tax History
| Year | Tax Paid | Tax Assessment Tax Assessment Total Assessment is a certain percentage of the fair market value that is determined by local assessors to be the total taxable value of land and additions on the property. | Land | Improvement |
|---|---|---|---|---|
| 2025 | $7,367 | $666,100 | $308,400 | $357,700 |
| 2024 | $7,136 | $568,600 | $212,900 | $355,700 |
| 2023 | $7,171 | $552,500 | $212,900 | $339,600 |
| 2022 | $6,989 | $496,400 | $185,200 | $311,200 |
| 2021 | $6,949 | $437,300 | $185,200 | $252,100 |
| 2020 | $6,962 | $437,300 | $185,200 | $252,100 |
| 2019 | $6,844 | $433,700 | $181,600 | $252,100 |
| 2018 | $6,887 | $433,700 | $181,600 | $252,100 |
| 2017 | $6,685 | $412,400 | $181,600 | $230,800 |
| 2016 | $6,470 | $407,700 | $181,600 | $226,100 |
| 2015 | $6,260 | $390,500 | $181,700 | $208,800 |
| 2014 | $5,487 | $390,500 | $181,700 | $208,800 |
Source: Public Records
Map
Nearby Homes
- 8 Molloy Rd
- 32 Summer St
- 11 Central St
- 206 W Main St Unit 5
- 206 W Main St Unit 4
- 206 W Main St Unit 2
- 206 W Main St Unit 3
- 231 W Main St
- 10 Ashcroft Cir
- 232 School St
- 11 Main St
- 13 Main St
- 66 Parish Rd Unit 8
- 98 West St
- 12 Warren St
- 38 Main St
- 901 Alyssa Dr
- 1 Atwood Ln
- 107 King George Dr Unit 9
- 18 Forest St
Your Personal Tour Guide
Ask me questions while you tour the home.