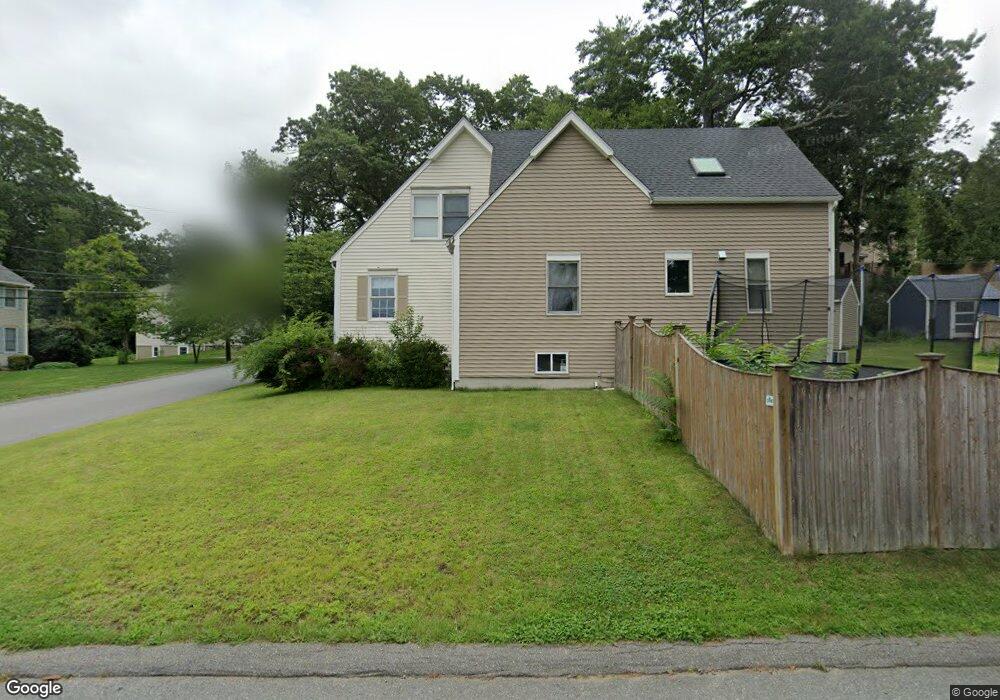
2 Moline Rd Burlington, MA 01803
Havenville NeighborhoodEstimated Value: $920,246 - $1,067,000
4
Beds
4
Baths
2,408
Sq Ft
$409/Sq Ft
Est. Value
About This Home
This home is located at 2 Moline Rd, Burlington, MA 01803 and is currently estimated at $983,812, approximately $408 per square foot. 2 Moline Rd is a home located in Middlesex County with nearby schools including Burlington High School, Pine Glen Elementary School, and Marshall Simonds Middle School.
Ownership History
Date
Name
Owned For
Owner Type
Purchase Details
Closed on
Oct 1, 2004
Sold by
Dillon Helen and Dillon John W
Bought by
Conlon Brian and Conlon Tania
Current Estimated Value
Home Financials for this Owner
Home Financials are based on the most recent Mortgage that was taken out on this home.
Original Mortgage
$300,000
Interest Rate
5.81%
Mortgage Type
Purchase Money Mortgage
Purchase Details
Closed on
May 12, 1993
Sold by
First Wisconsin T Co
Bought by
Dillon John W
Purchase Details
Closed on
Nov 2, 1992
Sold by
Ganley Thomas F
Bought by
First Wisconsin T Co
Purchase Details
Closed on
Aug 29, 1988
Sold by
Raymond Rt
Bought by
Ganley Thomas F
Create a Home Valuation Report for This Property
The Home Valuation Report is an in-depth analysis detailing your home's value as well as a comparison with similar homes in the area
Home Values in the Area
Average Home Value in this Area
Purchase History
| Date | Buyer | Sale Price | Title Company |
|---|---|---|---|
| Conlon Brian | $465,000 | -- | |
| Dillon John W | $90,700 | -- | |
| Dillon John W | $90,700 | -- | |
| First Wisconsin T Co | $165,845 | -- | |
| First Wisconsin T Co | $165,845 | -- | |
| Ganley Thomas F | $150,000 | -- |
Source: Public Records
Mortgage History
| Date | Status | Borrower | Loan Amount |
|---|---|---|---|
| Open | Ganley Thomas F | $275,000 | |
| Closed | Conlon Brian | $300,000 | |
| Previous Owner | Ganley Thomas F | $35,000 |
Source: Public Records
Tax History Compared to Growth
Tax History
| Year | Tax Paid | Tax Assessment Tax Assessment Total Assessment is a certain percentage of the fair market value that is determined by local assessors to be the total taxable value of land and additions on the property. | Land | Improvement |
|---|---|---|---|---|
| 2025 | $6,995 | $807,700 | $391,000 | $416,700 |
| 2024 | $6,990 | $781,900 | $357,000 | $424,900 |
| 2023 | $6,792 | $722,500 | $309,400 | $413,100 |
| 2022 | $6,548 | $658,100 | $281,400 | $376,700 |
| 2021 | $6,144 | $640,200 | $263,500 | $376,700 |
| 2020 | $6,131 | $636,000 | $259,300 | $376,700 |
| 2019 | $5,954 | $568,100 | $242,300 | $325,800 |
| 2018 | $5,817 | $547,700 | $235,500 | $312,200 |
| 2017 | $5,330 | $547,700 | $235,500 | $312,200 |
| 2016 | $4,899 | $427,500 | $204,000 | $223,500 |
| 2015 | $4,852 | $427,500 | $204,000 | $223,500 |
| 2014 | $4,762 | $396,800 | $181,900 | $214,900 |
Source: Public Records
Map
Nearby Homes
- 1 Nevada Rd
- 11 Violet Rd
- 42 Lantern Ln
- 20 Lantern Ln
- 23 County Rd
- 19 Carey Ave
- 9 Bruce St
- 21 Meadowvale Rd
- 12 Murray Ave Unit 18
- 1 Highland Way
- 0 Bedford St
- 12 Pleasant St
- 2 Stephanie St
- 29 Beaverbrook Rd
- 1 Hallmark Gardens Unit 8
- 42 Pinehurst Ave
- 38 Freeport Dr
- 225 Middlesex Turnpike Unit 109
- 225 Middlesex Turnpike Unit 105
- 225 Middlesex Turnpike Unit 106