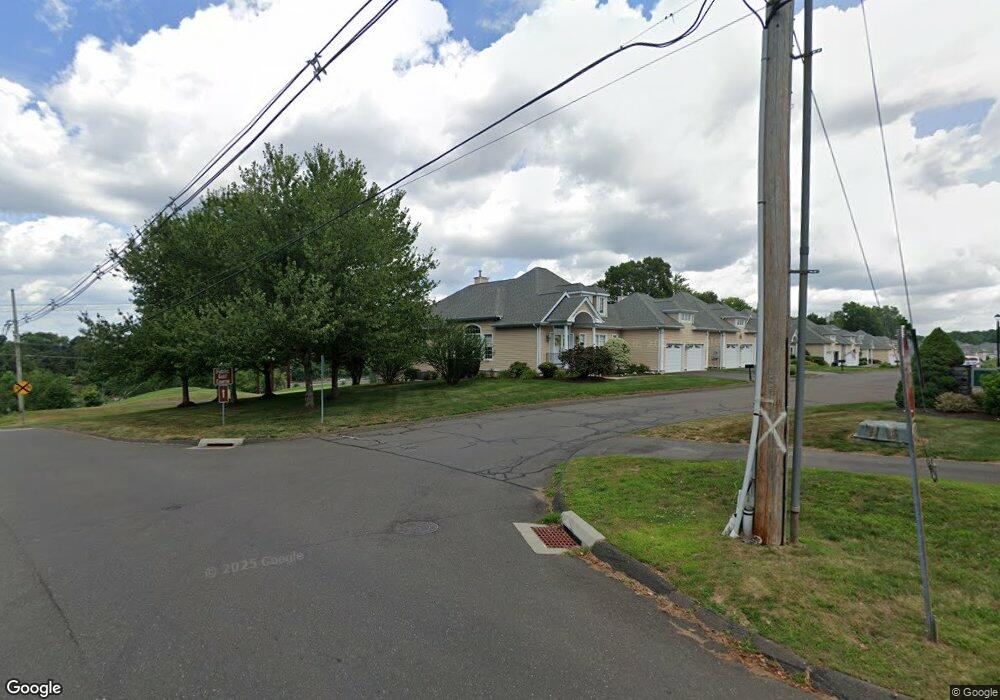
2 Mulligan Dr Wallingford, CT 06492
Estimated Value: $621,000 - $679,000
2
Beds
3
Baths
2,489
Sq Ft
$259/Sq Ft
Est. Value
About This Home
This home is located at 2 Mulligan Dr, Wallingford, CT 06492 and is currently estimated at $644,917, approximately $259 per square foot. 2 Mulligan Dr is a home located in New Haven County with nearby schools including Evarts C. Stevens School, Pond Hill Elementary School, and Dag Hammarskjold Middle School.
Ownership History
Date
Name
Owned For
Owner Type
Purchase Details
Closed on
May 18, 2016
Sold by
Clark Lawrence
Bought by
Ianniello William and Ianniello Dolores
Current Estimated Value
Purchase Details
Closed on
Dec 22, 2006
Sold by
Wills James B and Wills Karen A
Bought by
Clark Lawrence P
Home Financials for this Owner
Home Financials are based on the most recent Mortgage that was taken out on this home.
Original Mortgage
$416,000
Interest Rate
6.35%
Purchase Details
Closed on
Feb 14, 2006
Sold by
Ton Pat S and Le Hang D
Bought by
Wills Karen A and Wills James B
Home Financials for this Owner
Home Financials are based on the most recent Mortgage that was taken out on this home.
Original Mortgage
$285,000
Interest Rate
6.27%
Purchase Details
Closed on
Jul 26, 1999
Sold by
Mda Harbour Ridge
Bought by
Ton Phat S and Le Hang D
Create a Home Valuation Report for This Property
The Home Valuation Report is an in-depth analysis detailing your home's value as well as a comparison with similar homes in the area
Home Values in the Area
Average Home Value in this Area
Purchase History
| Date | Buyer | Sale Price | Title Company |
|---|---|---|---|
| Ianniello William | $480,000 | -- | |
| Clark Lawrence P | $520,000 | -- | |
| Wills Karen A | $449,000 | -- | |
| Ton Phat S | $309,400 | -- |
Source: Public Records
Mortgage History
| Date | Status | Borrower | Loan Amount |
|---|---|---|---|
| Previous Owner | Ton Phat S | $487,000 | |
| Previous Owner | Ton Phat S | $416,000 | |
| Previous Owner | Ton Phat S | $285,000 |
Source: Public Records
Tax History
| Year | Tax Paid | Tax Assessment Tax Assessment Total Assessment is a certain percentage of the fair market value that is determined by local assessors to be the total taxable value of land and additions on the property. | Land | Improvement |
|---|---|---|---|---|
| 2025 | $9,146 | $379,200 | $0 | $379,200 |
| 2024 | $9,042 | $294,900 | $0 | $294,900 |
| 2023 | $8,652 | $294,900 | $0 | $294,900 |
| 2022 | $8,564 | $294,900 | $0 | $294,900 |
| 2021 | $8,411 | $294,900 | $0 | $294,900 |
| 2020 | $7,020 | $240,500 | $0 | $240,500 |
| 2019 | $7,020 | $240,500 | $0 | $240,500 |
| 2018 | $6,888 | $240,500 | $0 | $240,500 |
| 2017 | $6,866 | $240,500 | $0 | $240,500 |
| 2016 | $6,708 | $240,500 | $0 | $240,500 |
| 2015 | $7,255 | $264,100 | $0 | $264,100 |
| 2014 | $7,102 | $264,100 | $0 | $264,100 |
Source: Public Records
Map
Nearby Homes
- 16 Quigley Rd
- 412 Pilgrim Harbor
- 357 Long Hill Rd
- 65 Tremper Dr
- 229 Woodhouse Ave
- 27 Tamarac Swamp Rd
- 10 Pilgrim Harbor Unit C
- 3 Pilgrim Harbor Unit C
- 10 Pilgrim Harbor Unit D
- 21 Putter Dr Unit 303S
- 16 Putter Dr Unit 207S
- 70 Putter Dr Unit 211
- 27 Londonderry Dr
- 924 E Center St
- 303 S Elm St Unit 303
- 93 Sigwin Dr
- 30 Mallard Ct Unit 30
- 57 Terrace Gardens Unit 57
- 69 Terrace Gardens
- 134 E Main St
- 23 Mulligan Dr
- 24 Mulligan Dr
- 25 Mulligan Dr
- 26 Mulligan Dr
- 22 Mulligan Dr
- 21 Mulligan Dr
- 21 Mulligan Dr Unit 21
- 27 Mulligan Dr
- 27 Mulligan Dr Unit 27
- 19 Mulligan Dr
- 19 Mulligan Dr Unit 19
- 29 Mulligan Dr
- 20 Mulligan Dr
- 20 Mulligan Dr Unit 20-
- 17 Mulligan Dr
- 31 Mulligan Dr
- 18 Mulligan Dr
- 15 Mulligan Dr
- 16 Mulligan Dr
- 16 Mulligan Dr Unit 16
Your Personal Tour Guide
Ask me questions while you tour the home.