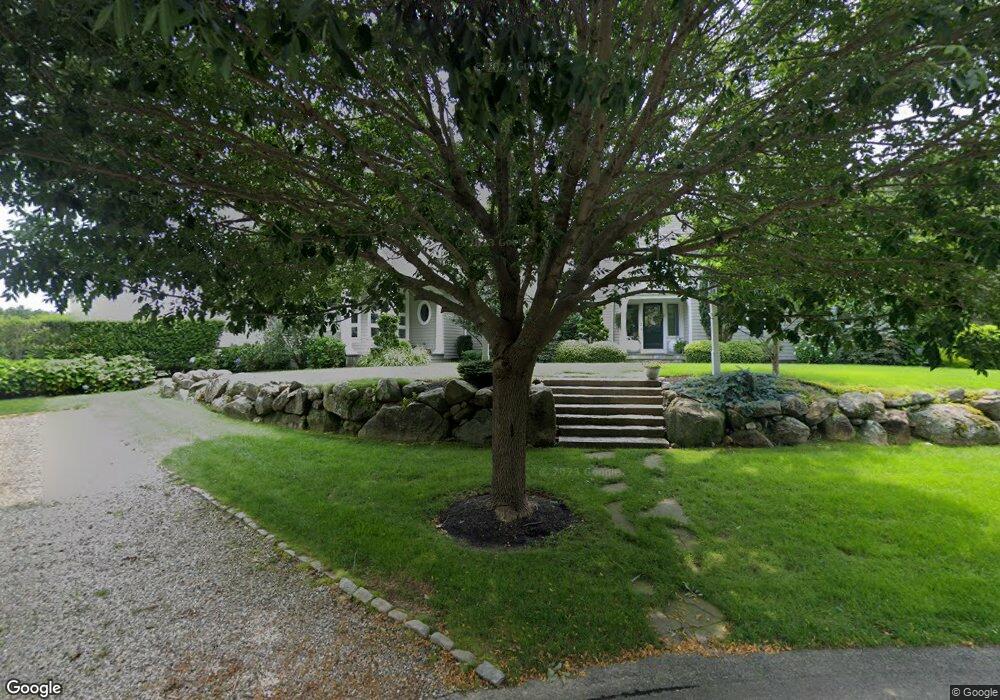
2 Mystic Dr South Dartmouth, MA 02748
Cow Yard/Nonquitt NeighborhoodEstimated Value: $1,364,200 - $1,415,000
4
Beds
3
Baths
3,528
Sq Ft
$392/Sq Ft
Est. Value
About This Home
This home is located at 2 Mystic Dr, South Dartmouth, MA 02748 and is currently estimated at $1,384,733, approximately $392 per square foot. 2 Mystic Dr is a home located in Bristol County with nearby schools including Dartmouth High School.
Ownership History
Date
Name
Owned For
Owner Type
Purchase Details
Closed on
Sep 29, 2010
Sold by
Simmons Peter E
Bought by
Peters Alfred C and Peters Jennifer B
Current Estimated Value
Home Financials for this Owner
Home Financials are based on the most recent Mortgage that was taken out on this home.
Original Mortgage
$572,000
Outstanding Balance
$379,184
Interest Rate
4.44%
Mortgage Type
Purchase Money Mortgage
Estimated Equity
$1,005,549
Purchase Details
Closed on
Oct 19, 2005
Sold by
Sasso Christopher J and Albro Danielle D
Bought by
Simmons Peter E
Home Financials for this Owner
Home Financials are based on the most recent Mortgage that was taken out on this home.
Original Mortgage
$668,000
Interest Rate
5.72%
Mortgage Type
Purchase Money Mortgage
Purchase Details
Closed on
Nov 30, 2001
Sold by
Melanson Thomas E
Bought by
Sasso Christopher J and Albro Danielle D
Purchase Details
Closed on
Jul 6, 2001
Sold by
Dartmouth Bldng Supply
Bought by
Melanson Thomas E
Create a Home Valuation Report for This Property
The Home Valuation Report is an in-depth analysis detailing your home's value as well as a comparison with similar homes in the area
Home Values in the Area
Average Home Value in this Area
Purchase History
| Date | Buyer | Sale Price | Title Company |
|---|---|---|---|
| Peters Alfred C | $715,000 | -- | |
| Simmons Peter E | $835,000 | -- | |
| Sasso Christopher J | $563,600 | -- | |
| Melanson Thomas E | $200,000 | -- |
Source: Public Records
Mortgage History
| Date | Status | Borrower | Loan Amount |
|---|---|---|---|
| Open | Melanson Thomas E | $572,000 | |
| Closed | Melanson Thomas E | $71,500 | |
| Previous Owner | Melanson Thomas E | $668,000 |
Source: Public Records
Tax History Compared to Growth
Tax History
| Year | Tax Paid | Tax Assessment Tax Assessment Total Assessment is a certain percentage of the fair market value that is determined by local assessors to be the total taxable value of land and additions on the property. | Land | Improvement |
|---|---|---|---|---|
| 2025 | $10,000 | $1,161,400 | $262,400 | $899,000 |
| 2024 | $9,899 | $1,139,100 | $262,400 | $876,700 |
| 2023 | $9,482 | $1,034,000 | $262,400 | $771,600 |
| 2022 | $8,568 | $865,500 | $235,200 | $630,300 |
| 2021 | $8,157 | $787,400 | $202,200 | $585,200 |
| 2020 | $8,132 | $783,400 | $202,200 | $581,200 |
| 2019 | $7,942 | $763,700 | $202,200 | $561,500 |
| 2018 | $7,182 | $710,400 | $189,900 | $520,500 |
| 2017 | $7,302 | $728,700 | $218,800 | $509,900 |
| 2016 | $6,897 | $678,800 | $174,300 | $504,500 |
| 2015 | $6,954 | $685,800 | $176,200 | $509,600 |
| 2014 | $6,729 | $659,100 | $185,700 | $473,400 |
Source: Public Records
Map
Nearby Homes
- 248 Bakerville Rd
- 105 Rock Odundee Rd
- 61 Pardon Hill Rd
- 24 White Alder Way
- 738 Smith Neck Rd
- Lot 1 Rafael Rd
- 482 Smith Neck Rd
- 1150 Russells Mills Rd
- 34 Country Way
- 75 Country Way Unit 75
- 76 Shipyard Ln
- 48 Wilson St
- 360 Russells Mills Rd
- Lot 2E Horseneck Rd
- 40 School St
- 21 Avis St
- 24 Eagle Dr
- 3 Mishawum Dr
- 23 High St
- 5 Samosett Dr
- 15 Highbridge Ln
- 5 Mystic Dr
- 11 Highbridge Ln
- 8 Highbridge Ln
- 19 Highbridge Ln
- 3 Highbridge Ln
- 2 Highbridge Ln
- Lot 2A Highbridge Ln
- 95 Bakerville Rd
- 67 Bakerville Rd
- 22 Highbridge Ln
- 23 Highbridge Ln
- 55 Bakerville Rd
- 99 Bakerville Rd
- 107 Bakerville Rd
- 117 Bakerville Rd
- 64 Bakerville Rd
- 45 Bakerville Rd
- 60 Bakerville Rd
- 49 Bakerville Rd