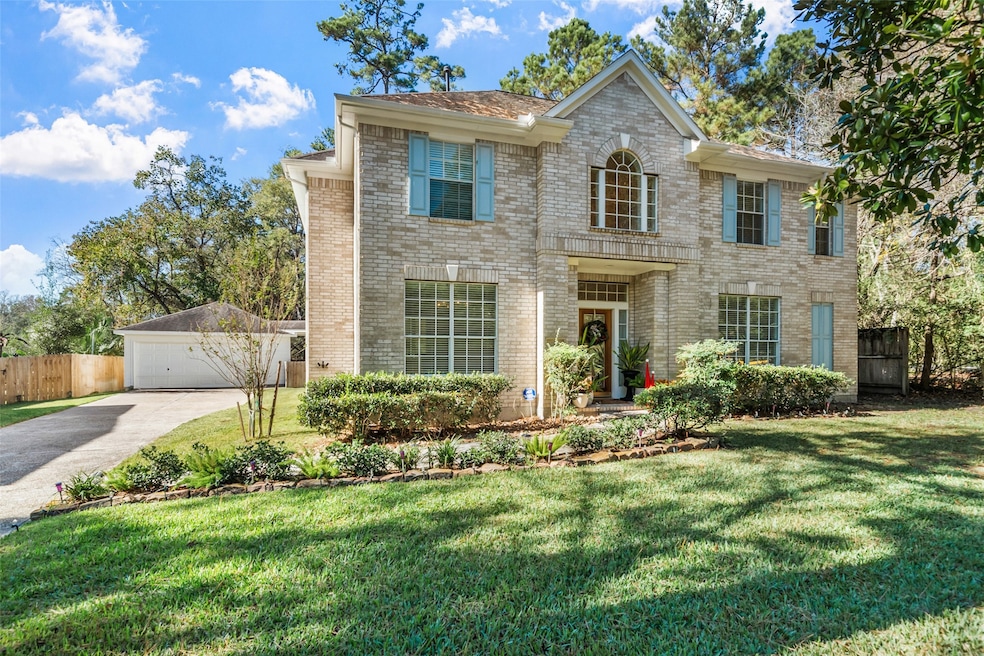


2 N Chantsong Cir Spring, TX 77382
Sterling Ridge NeighborhoodEstimated payment $5,294/month
Highlights
- Golf Course Community
- Located in a master-planned community
- Traditional Architecture
- Tough Elementary School Rated A
- Adjacent to Greenbelt
- 2-minute walk to Old Sterling Park
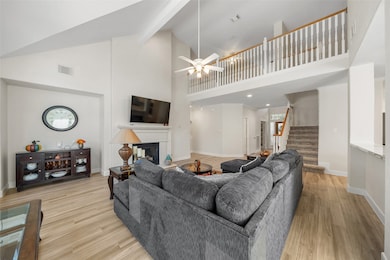
About This Home
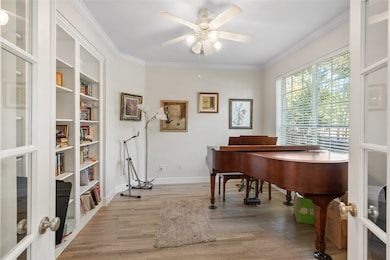
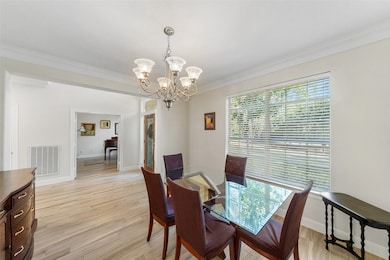
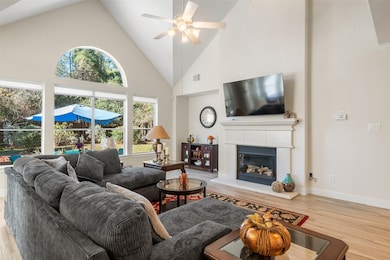
Gorgeous remodel in just that right location - chef style island kitchen with Marble counters, custom accent backsplash, stainless farmhouse sink, and 5 burner Gallery gas cooktop - open to the Great room with wall of windows to let the nature in. Serene Primary Bath custom remodel complete with large Marble walk in rainfall shower and separate relaxing tub. recent paint and carpet throughout. Detached oversized garage and large 11,905 sq ft lot. 5 bedrooms and large game room, home office with glass French doors, elegant entry and formal dining. Don't miss this opportunity...call now for personal tour
Home Details
Home Type
- Single Family
Est. Annual Taxes
- $11,025
Year Built
- Built in 2002
Lot Details
- 0.27 Acre Lot
- Adjacent to Greenbelt
- Sprinkler System
- Private Yard
Parking
- 2 Car Detached Garage
- Oversized Parking
Home Design
- Traditional Architecture
- Brick Exterior Construction
- Slab Foundation
- Composition Roof
- Cement Siding
Interior Spaces
- 3,354 Sq Ft Home
- 2-Story Property
- Crown Molding
- High Ceiling
- Wood Burning Fireplace
- Gas Log Fireplace
- Formal Entry
- Family Room Off Kitchen
- Breakfast Room
- Dining Room
- Home Office
- Game Room
- Washer and Gas Dryer Hookup
Kitchen
- Breakfast Bar
- Electric Oven
- Gas Cooktop
- Microwave
- Dishwasher
- Kitchen Island
- Marble Countertops
- Farmhouse Sink
- Disposal
Flooring
- Carpet
- Tile
Bedrooms and Bathrooms
- 5 Bedrooms
- En-Suite Primary Bedroom
- Double Vanity
- Hollywood Bathroom
- Separate Shower
Home Security
- Prewired Security
- Fire and Smoke Detector
Schools
- Tough Elementary School
- Mccullough Junior High School
- The Woodlands High School
Utilities
- Central Heating and Cooling System
- Heating System Uses Gas
Community Details
Overview
- The Woodlands Township Association
- Wdlnds Village Sterling Ridge Subdivision
- Located in a master-planned community
- Greenbelt
Recreation
- Golf Course Community
- Community Pool
- Park
- Trails
Map
Home Values in the Area
Average Home Value in this Area
Tax History
| Year | Tax Paid | Tax Assessment Tax Assessment Total Assessment is a certain percentage of the fair market value that is determined by local assessors to be the total taxable value of land and additions on the property. | Land | Improvement |
|---|---|---|---|---|
| 2025 | $6,795 | $735,359 | $100,000 | $635,359 |
| 2024 | $6,795 | $599,665 | -- | -- |
| 2023 | $6,723 | $545,150 | $100,000 | $528,030 |
| 2022 | $10,015 | $495,590 | $100,000 | $539,640 |
| 2021 | $9,829 | $450,540 | $90,000 | $360,540 |
| 2020 | $11,556 | $507,300 | $90,000 | $417,300 |
| 2019 | $11,627 | $493,870 | $90,000 | $403,870 |
| 2018 | $9,913 | $464,040 | $90,000 | $374,040 |
| 2017 | $11,520 | $483,310 | $90,000 | $393,310 |
| 2016 | $10,726 | $450,000 | $90,000 | $360,000 |
| 2015 | $9,989 | $450,000 | $90,000 | $360,000 |
| 2014 | $9,989 | $421,380 | $90,000 | $331,380 |
Property History
| Date | Event | Price | List to Sale | Price per Sq Ft |
|---|---|---|---|---|
| 02/03/2026 02/03/26 | Price Changed | $850,000 | -5.5% | $253 / Sq Ft |
| 12/04/2025 12/04/25 | For Sale | $899,000 | -- | $268 / Sq Ft |
Purchase History
| Date | Type | Sale Price | Title Company |
|---|---|---|---|
| Deed | -- | Capital Title | |
| Vendors Lien | -- | North American Title Co | |
| Deed | -- | -- |
Mortgage History
| Date | Status | Loan Amount | Loan Type |
|---|---|---|---|
| Closed | $637,500 | Construction | |
| Previous Owner | $30,570 | Purchase Money Mortgage | |
| Closed | $244,550 | No Value Available |
Source: Houston Association of REALTORS®
MLS Number: 62466566
APN: 9699-05-04100
Disclaimer: Certain information contained herein is derived from information provided by parties other than Homes.com. All information provided is deemed reliable, but is not guaranteed to be accurate and should be independently verified.
![]() Copyright 2026, Houston REALTORS® Information Service, Inc.
Copyright 2026, Houston REALTORS® Information Service, Inc.
The information provided is exclusively for consumers’ personal, non-commercial use, and may not be used for any purpose other than to identify prospective properties consumers may be interested in purchasing.
Information is deemed reliable but not guaranteed.
- 3 Farington Way
- 27 Silver Maple Place
- 7 Stanwick Place
- 7 N Spring Brook Ct
- 23 Villeroy Way
- 15 Netherfield Way
- 82 S Warbler Bend Cir
- 14 Mystic Pines Ct
- 58 S Longsford Cir
- 59 Douvaine Ct
- 6 Douvaine Ct
- 143 Hansom Trail St
- 18 Elfen Way
- 2 Lace Point
- 6607 Lake Woodlands Dr Unit 223
- 6607 Lake Woodlands Dr Unit 312
- 10 Lace Point
- 43 Philbrook Way
- 31 Lenox Hill Ct
- 88 W Grand Regency Cir
- 14 Mystic Pines Ct
- 31 N Warbler Bend Cir
- 38 E Thymewood Place
- 6900 Lake Woodlands Dr
- 66 S Longsford Cir
- 59 Douvaine Ct
- 30 N Palmiera Cir
- 50 N Lansdowne Cir
- 171 E Lansdowne Cir
- 60 W Indian Sage Cir
- 2 Peachridge Place
- 11 Cheswood Manor Ct
- 11 Orion Star Ct
- 19 Peachridge Place
- 38 Cheswood Manor Dr
- 43 Blue Creek Place
- 7 Ivy Castle Ct
- 143 S Vesper Bend Cir
- 10 Druids Glen Place
- 43 W Loftwood Cir

Ask me questions while you tour the home.