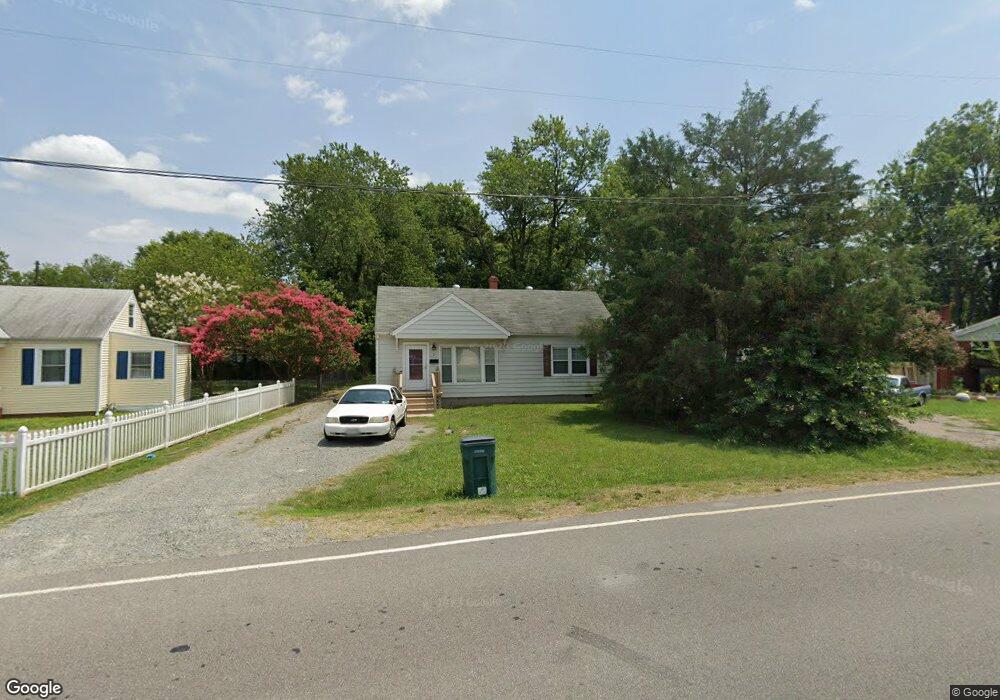
2 Naglee Ave Sandston, VA 23150
Estimated Value: $218,000 - $238,000
2
Beds
1
Bath
1,016
Sq Ft
$224/Sq Ft
Est. Value
About This Home
This home is located at 2 Naglee Ave, Sandston, VA 23150 and is currently estimated at $227,124, approximately $223 per square foot. 2 Naglee Ave is a home located in Henrico County with nearby schools including Sandston Elementary School, Elko Middle School, and Highland Springs High School.
Ownership History
Date
Name
Owned For
Owner Type
Purchase Details
Closed on
Dec 29, 1998
Sold by
Mccoy Daniel R and Mccoy S
Current Estimated Value
Purchase Details
Closed on
Jul 21, 1998
Sold by
Stauffer Blanch N
Bought by
Mccoy Daniel R and Mccoy Mary S
Home Financials for this Owner
Home Financials are based on the most recent Mortgage that was taken out on this home.
Original Mortgage
$52,000
Interest Rate
6.98%
Mortgage Type
New Conventional
Create a Home Valuation Report for This Property
The Home Valuation Report is an in-depth analysis detailing your home's value as well as a comparison with similar homes in the area
Home Values in the Area
Average Home Value in this Area
Purchase History
| Date | Buyer | Sale Price | Title Company |
|---|---|---|---|
| -- | -- | -- | |
| Mccoy Daniel R | $52,000 | -- |
Source: Public Records
Mortgage History
| Date | Status | Borrower | Loan Amount |
|---|---|---|---|
| Previous Owner | Mccoy Daniel R | $52,000 |
Source: Public Records
Tax History
| Year | Tax Paid | Tax Assessment Tax Assessment Total Assessment is a certain percentage of the fair market value that is determined by local assessors to be the total taxable value of land and additions on the property. | Land | Improvement |
|---|---|---|---|---|
| 2025 | $1,743 | $183,800 | $41,000 | $142,800 |
| 2024 | $1,743 | $169,500 | $39,000 | $130,500 |
| 2023 | $1,446 | $169,500 | $39,000 | $130,500 |
| 2022 | $1,182 | $145,400 | $37,000 | $108,400 |
| 2021 | $1,116 | $122,400 | $33,000 | $89,400 |
| 2020 | $1,069 | $122,400 | $33,000 | $89,400 |
| 2019 | $1,035 | $118,600 | $31,000 | $87,600 |
| 2018 | $973 | $111,400 | $31,000 | $80,400 |
| 2017 | $910 | $104,200 | $31,000 | $73,200 |
| 2016 | $862 | $98,700 | $31,000 | $67,700 |
| 2015 | $822 | $98,700 | $31,000 | $67,700 |
| 2014 | $822 | $94,200 | $31,000 | $63,200 |
Source: Public Records
Map
Nearby Homes
- 305 E Union St
- 220 Casey St
- 2012 E Nine Mile Rd
- 14 Medlock Rd
- 219 Defense Ave
- 210 Stuttaford Dr
- 615 Howard St
- 202 Huger Ct
- 1601 Gatewood Ave
- 307 Bernie Ct
- 1460 Farley Ct
- 1675 Meadow Rd
- 1413 Green Pasture Rd
- 203 Meadow Rd
- 963 Taylor Green Dr
- 912 Scotch Pine Ct
- 917 Scotch Pine Ct
- 1920 Meadow Rd
- 501 Sherilyn Dr
- 13 N Rose Ave
Your Personal Tour Guide
Ask me questions while you tour the home.