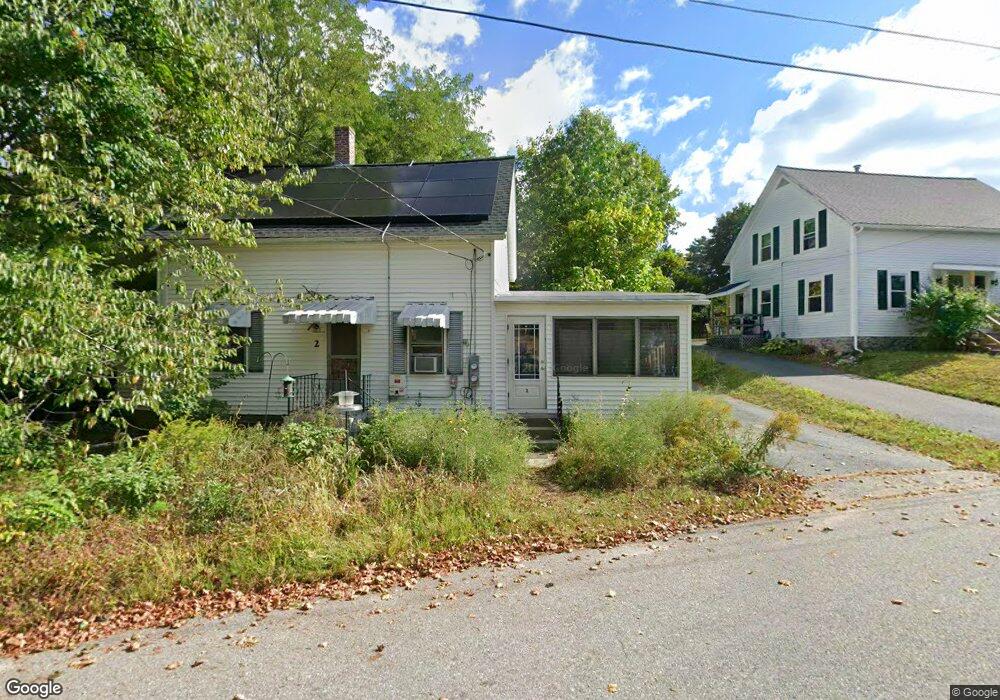
2 Nashua St Shirley, MA 01464
Estimated Value: $424,996 - $548,000
3
Beds
3
Baths
1,490
Sq Ft
$318/Sq Ft
Est. Value
About This Home
This home is located at 2 Nashua St, Shirley, MA 01464 and is currently estimated at $473,499, approximately $317 per square foot. 2 Nashua St is a home located in Middlesex County with nearby schools including Page Hilltop School, Lura A. White Elementary School, and Ayer Shirley Regional Middle School.
Ownership History
Date
Name
Owned For
Owner Type
Purchase Details
Closed on
Jan 16, 2004
Sold by
Nelson Joan L
Bought by
Haycock Libby J and Meagher Daniel J
Current Estimated Value
Home Financials for this Owner
Home Financials are based on the most recent Mortgage that was taken out on this home.
Original Mortgage
$227,500
Outstanding Balance
$106,983
Interest Rate
5.98%
Mortgage Type
Purchase Money Mortgage
Estimated Equity
$366,516
Purchase Details
Closed on
Dec 10, 2001
Sold by
Morais Edmond A and Morais Donna L
Bought by
Nelson Joan L
Create a Home Valuation Report for This Property
The Home Valuation Report is an in-depth analysis detailing your home's value as well as a comparison with similar homes in the area
Home Values in the Area
Average Home Value in this Area
Purchase History
| Date | Buyer | Sale Price | Title Company |
|---|---|---|---|
| Haycock Libby J | $227,500 | -- | |
| Nelson Joan L | $160,000 | -- |
Source: Public Records
Mortgage History
| Date | Status | Borrower | Loan Amount |
|---|---|---|---|
| Open | Haycock Libby J | $227,500 |
Source: Public Records
Tax History Compared to Growth
Tax History
| Year | Tax Paid | Tax Assessment Tax Assessment Total Assessment is a certain percentage of the fair market value that is determined by local assessors to be the total taxable value of land and additions on the property. | Land | Improvement |
|---|---|---|---|---|
| 2025 | $47 | $360,500 | $130,000 | $230,500 |
| 2024 | $4,458 | $328,500 | $110,900 | $217,600 |
| 2023 | $4,329 | $305,300 | $110,900 | $194,400 |
| 2022 | $4,192 | $270,800 | $107,100 | $163,700 |
| 2021 | $4,061 | $245,700 | $95,600 | $150,100 |
| 2020 | $9,948 | $243,100 | $95,600 | $147,500 |
| 2019 | $3,743 | $232,800 | $95,600 | $137,200 |
| 2018 | $9,799 | $216,200 | $91,800 | $124,400 |
| 2017 | $3,273 | $198,100 | $84,100 | $114,000 |
| 2016 | $3,234 | $195,900 | $85,700 | $110,200 |
| 2015 | $3,142 | $181,500 | $80,300 | $101,200 |
Source: Public Records
Map
Nearby Homes
- 25 Front St
- 40 Ayer Rd
- 3 Mill St
- 30 Ayer Rd
- 27 Lancaster Rd
- 45 Clark Rd
- 3 Ambrose Way Unit 3
- 6 Ambrose Way Unit 3
- 19 Ambrose Way Unit 19
- 9 Ambrose Way Unit 9
- 1 Ambrose Way Unit 1
- 7 Ambrose Way Unit 5
- 4 Ambrose Way Unit 4
- 5 Ambrose Way Unit 5
- 13 Ambrose Way Unit 13
- 0 Windsor Rd
- 83 Clark Rd Unit 41
- 95 Old Union Turnpike
- 31 Independence Dr
- 124 Hazen Rd
- 4 Nashua St
- 24 Shaker Rd
- 24 Shaker Rd Unit C
- 24 Shaker Rd Unit 2
- 30 Shaker Rd
- 6 Nashua St
- 22 Shaker Rd
- 25 Shaker Rd
- 19 Shaker Rd Unit A
- 17 Rodman Ave
- 15 A-B Rodman Ave
- 5 A Nashua St Unit 1
- 5 B Nashua St Unit 1
- 5 Nashua St Unit B
- 5 Nashua St
- 8 Nashua St
- 15 Rodman Ave Unit B
- 15 Rodman Ave
- 15 Rodman Ave Unit B (left)
- 15 Rodman Ave Unit A (right)