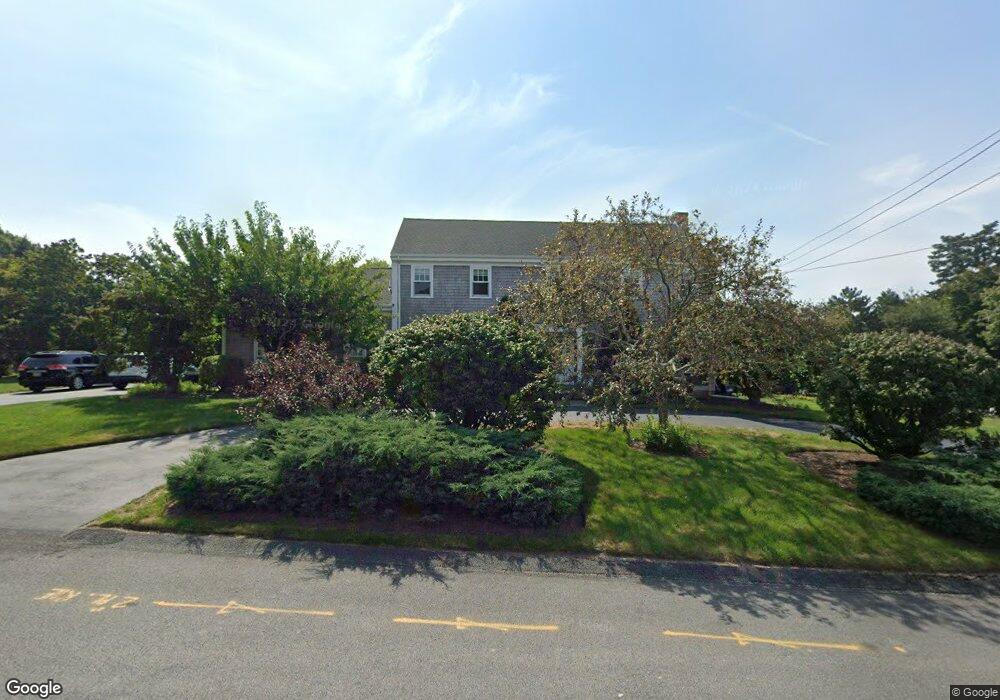
2 Nayatt Point Ct Barrington, RI 02806
Nayatt NeighborhoodEstimated Value: $1,564,000 - $2,360,000
4
Beds
4
Baths
3,532
Sq Ft
$543/Sq Ft
Est. Value
About This Home
This home is located at 2 Nayatt Point Ct, Barrington, RI 02806 and is currently estimated at $1,919,274, approximately $543 per square foot. 2 Nayatt Point Ct is a home located in Bristol County with nearby schools including Barrington High School, St Luke Elementary School, and Barrington Christian Academy.
Ownership History
Date
Name
Owned For
Owner Type
Purchase Details
Closed on
Aug 9, 2005
Sold by
Frost Cynthia E
Bought by
Mellen Charles S and Mellen Rachel
Current Estimated Value
Purchase Details
Closed on
May 17, 2000
Sold by
Sherer Joseph F and Sherer Catherine
Bought by
Frost Cynthia E
Purchase Details
Closed on
Mar 10, 1997
Sold by
Henley Joseph M and Henley Kimberly
Bought by
Sherer Joseph F and Sherer Catherine
Create a Home Valuation Report for This Property
The Home Valuation Report is an in-depth analysis detailing your home's value as well as a comparison with similar homes in the area
Home Values in the Area
Average Home Value in this Area
Purchase History
| Date | Buyer | Sale Price | Title Company |
|---|---|---|---|
| Mellen Charles S | $1,375,000 | -- | |
| Frost Cynthia E | $835,000 | -- | |
| Sherer Joseph F | $640,000 | -- |
Source: Public Records
Mortgage History
| Date | Status | Borrower | Loan Amount |
|---|---|---|---|
| Open | Sherer Joseph F | $867,295 | |
| Closed | Sherer Joseph F | $816,000 | |
| Closed | Sherer Joseph F | $55,000 |
Source: Public Records
Tax History Compared to Growth
Tax History
| Year | Tax Paid | Tax Assessment Tax Assessment Total Assessment is a certain percentage of the fair market value that is determined by local assessors to be the total taxable value of land and additions on the property. | Land | Improvement |
|---|---|---|---|---|
| 2025 | $24,437 | $1,593,000 | $978,000 | $615,000 |
| 2024 | $23,497 | $1,593,000 | $978,000 | $615,000 |
| 2023 | $24,157 | $1,190,000 | $728,000 | $462,000 |
| 2022 | $23,384 | $1,190,000 | $728,000 | $462,000 |
| 2021 | $22,789 | $1,190,000 | $728,000 | $462,000 |
| 2020 | $26,355 | $1,261,000 | $832,000 | $429,000 |
| 2019 | $25,346 | $1,261,000 | $832,000 | $429,000 |
| 2018 | $24,590 | $1,261,000 | $832,000 | $429,000 |
| 2017 | $24,768 | $1,238,400 | $853,200 | $385,200 |
| 2016 | $22,848 | $1,238,400 | $853,200 | $385,200 |
| 2015 | $22,601 | $1,238,400 | $853,200 | $385,200 |
| 2014 | $22,741 | $1,242,700 | $915,700 | $327,000 |
Source: Public Records
Map
Nearby Homes
- 85 Nayatt Rd
- 6 Conway Dr
- 150 Alfred Drowne Rd
- 4 Buckingham St
- 1 3rd St
- 381 Maple Ave
- 299 Narragansett Ave
- 15 Elgin St Unit St
- 15 Elgin St
- 7 Carpenter Ave
- 20 Townsend St
- 0 Bogman Rd
- 205 Lincoln Ave
- 72 Highland Ave
- 164 Bay Spring Ave
- 15 Spadina Ave
- 29 Lake Ave
- 41 Spadina Ave
- 248 Point Ave
- 351 County Rd