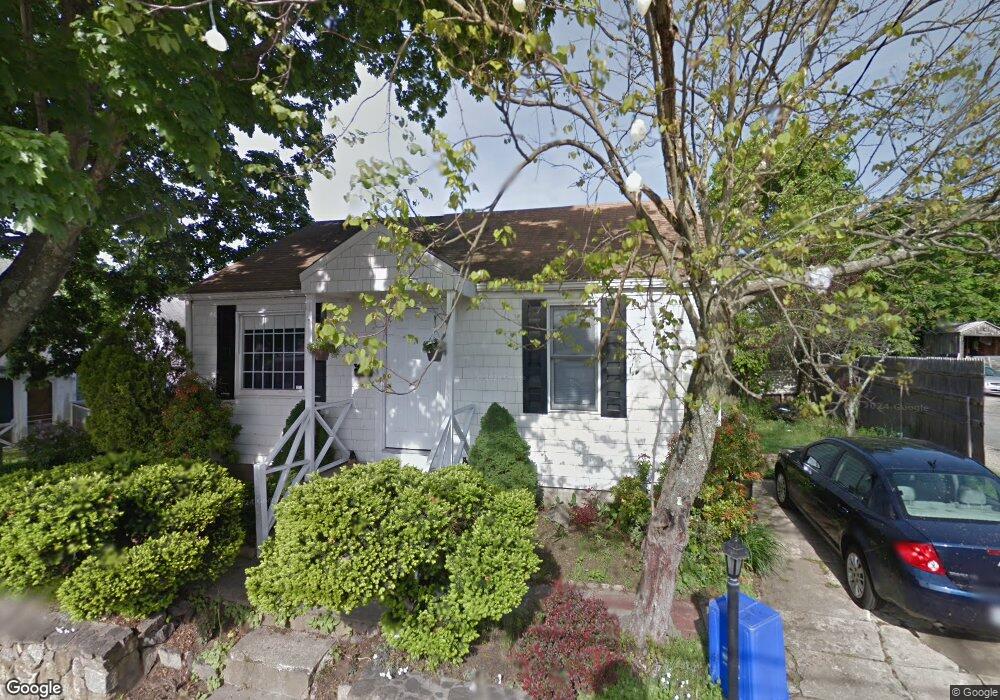
2 Newell Ct Coventry, RI 02816
Estimated Value: $252,000 - $338,000
2
Beds
1
Bath
672
Sq Ft
$426/Sq Ft
Est. Value
About This Home
This home is located at 2 Newell Ct, Coventry, RI 02816 and is currently estimated at $286,108, approximately $425 per square foot. 2 Newell Ct is a home located in Kent County with nearby schools including Alan Shawn Feinstein Ms Of Cov, Coventry High School, and Father John V. Doyle School.
Ownership History
Date
Name
Owned For
Owner Type
Purchase Details
Closed on
Aug 31, 2023
Sold by
Thomas L Marcotte T L and Thomas Marcotte
Bought by
Matti J Llc
Current Estimated Value
Home Financials for this Owner
Home Financials are based on the most recent Mortgage that was taken out on this home.
Original Mortgage
$58,000
Outstanding Balance
$56,440
Interest Rate
6.78%
Mortgage Type
Purchase Money Mortgage
Estimated Equity
$229,668
Purchase Details
Closed on
Dec 31, 2015
Sold by
Marcotte Thomas L
Bought by
Thomas L Marcotte Ret and Marcotte
Purchase Details
Closed on
Feb 8, 2008
Sold by
Wells Fargo Bank Na
Bought by
Marcotte Thomas L
Purchase Details
Closed on
Apr 4, 2005
Sold by
Nelson Gary D and Nelson Marshal
Bought by
Nelson Mark A and Nelson Ana L
Home Financials for this Owner
Home Financials are based on the most recent Mortgage that was taken out on this home.
Original Mortgage
$115,000
Interest Rate
5.61%
Mortgage Type
Purchase Money Mortgage
Create a Home Valuation Report for This Property
The Home Valuation Report is an in-depth analysis detailing your home's value as well as a comparison with similar homes in the area
Purchase History
| Date | Buyer | Sale Price | Title Company |
|---|---|---|---|
| Matti J Llc | $61,000 | None Available | |
| Thomas L Marcotte Ret | -- | -- | |
| Marcotte Thomas L | $69,000 | -- | |
| Nelson Mark A | $154,500 | -- |
Source: Public Records
Mortgage History
| Date | Status | Borrower | Loan Amount |
|---|---|---|---|
| Open | Matti J Llc | $58,000 | |
| Previous Owner | Nelson Mark A | $148,300 | |
| Previous Owner | Nelson Mark A | $115,000 |
Source: Public Records
Tax History
| Year | Tax Paid | Tax Assessment Tax Assessment Total Assessment is a certain percentage of the fair market value that is determined by local assessors to be the total taxable value of land and additions on the property. | Land | Improvement |
|---|---|---|---|---|
| 2025 | $2,127 | $132,200 | $34,500 | $97,700 |
| 2024 | $2,080 | $131,300 | $34,500 | $96,800 |
| 2023 | $2,013 | $131,300 | $34,500 | $96,800 |
| 2022 | $2,029 | $103,700 | $33,000 | $70,700 |
| 2021 | $2,012 | $103,700 | $33,000 | $70,700 |
| 2020 | $2,306 | $103,700 | $33,000 | $70,700 |
| 2019 | $1,719 | $77,300 | $16,200 | $61,100 |
| 2018 | $1,670 | $77,300 | $16,200 | $61,100 |
| 2017 | $1,622 | $77,300 | $16,200 | $61,100 |
| 2016 | $1,516 | $70,800 | $15,300 | $55,500 |
| 2015 | $1,475 | $70,800 | $15,300 | $55,500 |
| 2014 | $1,444 | $70,800 | $15,300 | $55,500 |
| 2013 | $1,551 | $83,100 | $19,500 | $63,600 |
Source: Public Records
Map
Nearby Homes
Your Personal Tour Guide
Ask me questions while you tour the home.