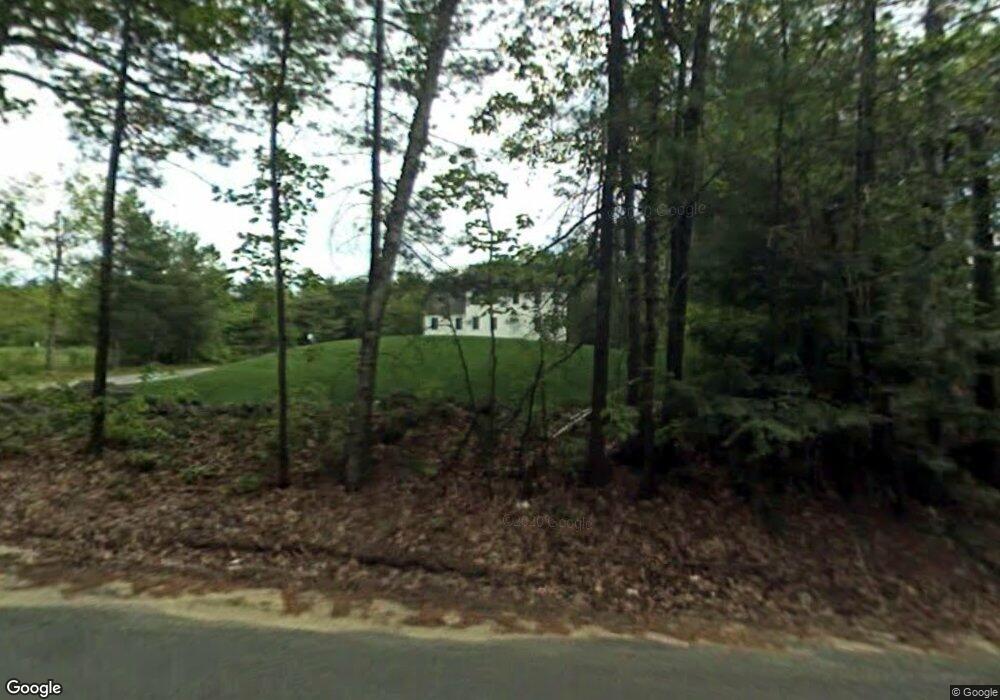
2 Newton Rd Westminster, MA 01473
Estimated Value: $608,000 - $830,000
4
Beds
3
Baths
2,531
Sq Ft
$268/Sq Ft
Est. Value
About This Home
This home is located at 2 Newton Rd, Westminster, MA 01473 and is currently estimated at $678,390, approximately $268 per square foot. 2 Newton Rd is a home located in Worcester County with nearby schools including Oakmont Regional High School.
Ownership History
Date
Name
Owned For
Owner Type
Purchase Details
Closed on
Oct 3, 2025
Sold by
Perkins Patrick G and Perkins Nancy E
Bought by
Perkins Lt and Perkins
Current Estimated Value
Purchase Details
Closed on
Jun 19, 2002
Sold by
Swenson Swen T and Swenson Lisa A
Bought by
Perkins Patrick G and Perkins Nancy E
Create a Home Valuation Report for This Property
The Home Valuation Report is an in-depth analysis detailing your home's value as well as a comparison with similar homes in the area
Home Values in the Area
Average Home Value in this Area
Purchase History
| Date | Buyer | Sale Price | Title Company |
|---|---|---|---|
| Perkins Lt | -- | -- | |
| Perkins Patrick G | $85,000 | -- |
Source: Public Records
Mortgage History
| Date | Status | Borrower | Loan Amount |
|---|---|---|---|
| Previous Owner | Perkins Patrick G | $110,900 | |
| Previous Owner | Perkins Patrick G | $220,000 |
Source: Public Records
Tax History
| Year | Tax Paid | Tax Assessment Tax Assessment Total Assessment is a certain percentage of the fair market value that is determined by local assessors to be the total taxable value of land and additions on the property. | Land | Improvement |
|---|---|---|---|---|
| 2025 | $6,395 | $519,900 | $127,200 | $392,700 |
| 2024 | $6,079 | $495,800 | $127,200 | $368,600 |
| 2023 | $6,156 | $471,400 | $118,800 | $352,600 |
| 2022 | $6,339 | $401,200 | $103,200 | $298,000 |
| 2021 | $5,332 | $376,400 | $90,000 | $286,400 |
| 2020 | $6,199 | $353,200 | $81,600 | $271,600 |
| 2019 | $6,194 | $339,400 | $67,800 | $271,600 |
| 2018 | $5,408 | $321,800 | $67,800 | $254,000 |
| 2017 | $5,795 | $318,600 | $67,800 | $250,800 |
| 2016 | $5,649 | $300,800 | $56,400 | $244,400 |
| 2015 | $5,624 | $296,800 | $56,400 | $240,400 |
| 2014 | $5,633 | $296,800 | $56,400 | $240,400 |
Source: Public Records
Map
Nearby Homes
Your Personal Tour Guide
Ask me questions while you tour the home.