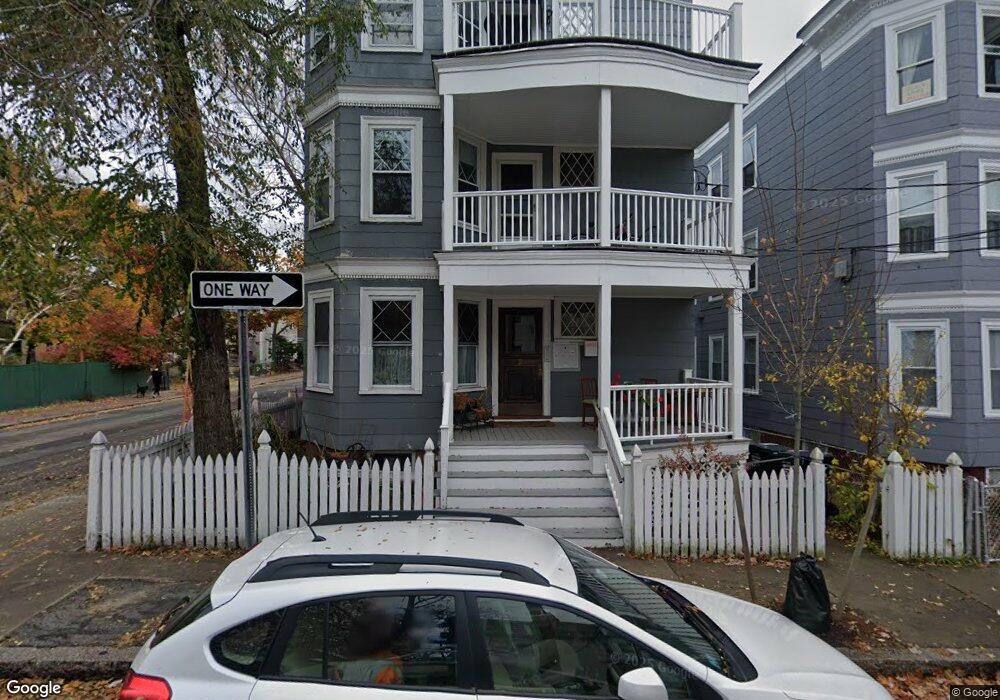
2 Newton St Unit 1 Cambridge, MA 02139
Cambridgeport NeighborhoodEstimated Value: $878,265 - $1,071,000
3
Beds
2
Baths
1,090
Sq Ft
$907/Sq Ft
Est. Value
About This Home
This home is located at 2 Newton St Unit 1, Cambridge, MA 02139 and is currently estimated at $988,566, approximately $906 per square foot. 2 Newton St Unit 1 is a home located in Middlesex County with nearby schools including Prospect Hill Academy Charter School, New England Hebrew Academy, and Boston University Academy.
Ownership History
Date
Name
Owned For
Owner Type
Purchase Details
Closed on
Aug 31, 2018
Sold by
Susanna M Flug-Silva
Bought by
Laochamroonvorapongse Philip Li Hsuan and Laochamroonvorapongse Carmen
Current Estimated Value
Home Financials for this Owner
Home Financials are based on the most recent Mortgage that was taken out on this home.
Original Mortgage
$620,000
Outstanding Balance
$539,797
Interest Rate
4.52%
Estimated Equity
$448,769
Purchase Details
Closed on
May 26, 2000
Sold by
Steinberg Shira J
Bought by
Ralls Jason A and Sims Kirsten A
Home Financials for this Owner
Home Financials are based on the most recent Mortgage that was taken out on this home.
Original Mortgage
$271,700
Interest Rate
8.1%
Mortgage Type
Purchase Money Mortgage
Purchase Details
Closed on
Jun 1, 1987
Sold by
2 Newton St Condo
Bought by
Steinberg Shira J
Create a Home Valuation Report for This Property
The Home Valuation Report is an in-depth analysis detailing your home's value as well as a comparison with similar homes in the area
Home Values in the Area
Average Home Value in this Area
Purchase History
| Date | Buyer | Sale Price | Title Company |
|---|---|---|---|
| Laochamroonvorapongse Philip Li Hsuan | $775,000 | -- | |
| Ralls Jason A | $286,000 | -- | |
| Steinberg Shira J | $172,000 | -- |
Source: Public Records
Mortgage History
| Date | Status | Borrower | Loan Amount |
|---|---|---|---|
| Open | Steinberg Shira J | $620,000 | |
| Closed | Steinberg Shira J | -- | |
| Previous Owner | Steinberg Shira J | $271,700 |
Source: Public Records
Tax History Compared to Growth
Tax History
| Year | Tax Paid | Tax Assessment Tax Assessment Total Assessment is a certain percentage of the fair market value that is determined by local assessors to be the total taxable value of land and additions on the property. | Land | Improvement |
|---|---|---|---|---|
| 2025 | $4,639 | $730,600 | $0 | $730,600 |
| 2024 | $4,301 | $726,600 | $0 | $726,600 |
| 2023 | $4,123 | $703,500 | $0 | $703,500 |
| 2022 | $4,106 | $693,500 | $0 | $693,500 |
| 2021 | $4,019 | $687,000 | $0 | $687,000 |
| 2020 | $3,835 | $667,000 | $0 | $667,000 |
| 2019 | $3,671 | $618,000 | $0 | $618,000 |
| 2018 | $3,563 | $566,400 | $0 | $566,400 |
| 2017 | $3,423 | $527,500 | $0 | $527,500 |
| 2016 | $3,259 | $466,300 | $0 | $466,300 |
| 2015 | $3,223 | $412,100 | $0 | $412,100 |
| 2014 | $3,026 | $361,100 | $0 | $361,100 |
Source: Public Records
Map
Nearby Homes
- 214 Allston St
- 164-170 Allston St
- 100 Magazine St Unit 2
- 161 Hamilton St
- 21 Florence St
- 120 Pleasant St Unit 1
- 201 Brookline St Unit 6
- 15 Fairmont St
- 594 Putnam Ave Unit 2
- 131 Erie St Unit 3
- 131 Erie St Unit 1
- 131 Erie St Unit 2
- 131 Erie St
- 260 Sidney St Unit 3R
- 135-139 Pearl St Unit 1
- 125 Brookline St Unit 4
- 118 Pearl St Unit 2
- 8 Lopez St
- 1 Jay St
- 6-8 Watson St Unit 8
- 2 Newton St Unit 2
- 2 Newton St Unit 3
- 2 Newton St
- 4 Newton St
- 472 Putnam Ave Unit 2
- 472 Putnam Ave Unit 2B
- 472 Putnam Ave
- 6 Newton St
- 6 Newton St Unit 2##
- 482 Putnam Ave
- 273 Pearl St
- 8 Newton St Unit 3
- 8 Newton St Unit 2
- 8 Newton St Unit 1
- 466 Putnam Ave
- 466 Putnam Ave Unit 466
- 466 Putnam Ave Unit 1
- 466 Putnam Ave Unit 2
- 261 Pearl St
- 468 Putnam Ave Unit 468