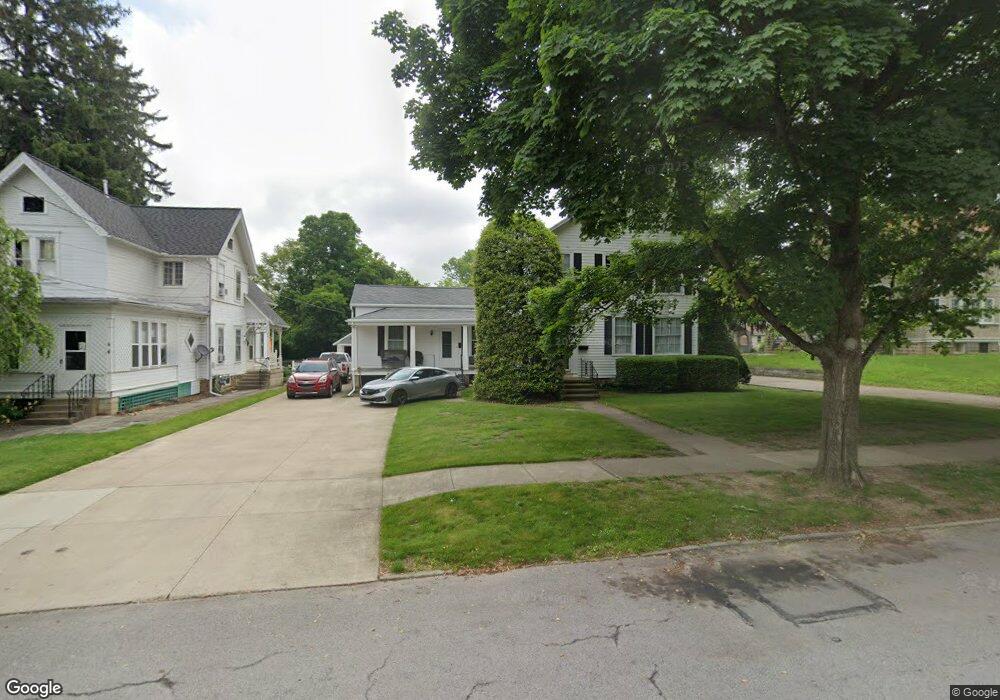
2 Newton St Norwalk, OH 44857
Estimated Value: $64,000 - $160,000
3
Beds
2
Baths
3,256
Sq Ft
$35/Sq Ft
Est. Value
About This Home
This home is located at 2 Newton St, Norwalk, OH 44857 and is currently estimated at $113,719, approximately $34 per square foot. 2 Newton St is a home located in Huron County with nearby schools including Maplehurst Elementary School, Pleasant Elementary School, and League Elementary School.
Ownership History
Date
Name
Owned For
Owner Type
Purchase Details
Closed on
Mar 20, 2025
Sold by
Angell Deborah L
Bought by
Nickoli Joshua J and Nickoli Jennifer J
Current Estimated Value
Home Financials for this Owner
Home Financials are based on the most recent Mortgage that was taken out on this home.
Original Mortgage
$108,745
Outstanding Balance
$108,191
Interest Rate
6.89%
Mortgage Type
FHA
Estimated Equity
$5,528
Purchase Details
Closed on
Mar 6, 2015
Sold by
Angell Christopher and Angell Deborah L
Bought by
Angell Christopher and Angell Deborah L
Purchase Details
Closed on
Aug 10, 1984
Bought by
Angell Christopher
Create a Home Valuation Report for This Property
The Home Valuation Report is an in-depth analysis detailing your home's value as well as a comparison with similar homes in the area
Home Values in the Area
Average Home Value in this Area
Purchase History
| Date | Buyer | Sale Price | Title Company |
|---|---|---|---|
| Nickoli Joshua J | $56,250 | Chicago Title | |
| Angell Christopher | -- | Attorney | |
| Angell Christopher | -- | -- |
Source: Public Records
Mortgage History
| Date | Status | Borrower | Loan Amount |
|---|---|---|---|
| Open | Nickoli Joshua J | $108,745 |
Source: Public Records
Tax History Compared to Growth
Tax History
| Year | Tax Paid | Tax Assessment Tax Assessment Total Assessment is a certain percentage of the fair market value that is determined by local assessors to be the total taxable value of land and additions on the property. | Land | Improvement |
|---|---|---|---|---|
| 2024 | $1,396 | $43,610 | $8,350 | $35,260 |
| 2023 | $1,396 | $36,130 | $6,090 | $30,040 |
| 2022 | $1,119 | $36,130 | $6,090 | $30,040 |
| 2021 | $1,119 | $36,130 | $6,090 | $30,040 |
| 2020 | $1,403 | $41,430 | $6,090 | $35,340 |
| 2019 | $1,373 | $41,430 | $6,090 | $35,340 |
| 2018 | $1,349 | $41,430 | $6,090 | $35,340 |
| 2017 | $1,558 | $46,320 | $6,090 | $40,230 |
| 2016 | $1,529 | $46,320 | $6,090 | $40,230 |
| 2015 | $1,528 | $46,320 | $6,090 | $40,230 |
| 2014 | $1,427 | $43,510 | $5,360 | $38,150 |
| 2013 | $1,243 | $43,510 | $5,360 | $38,150 |
Source: Public Records
Map
Nearby Homes