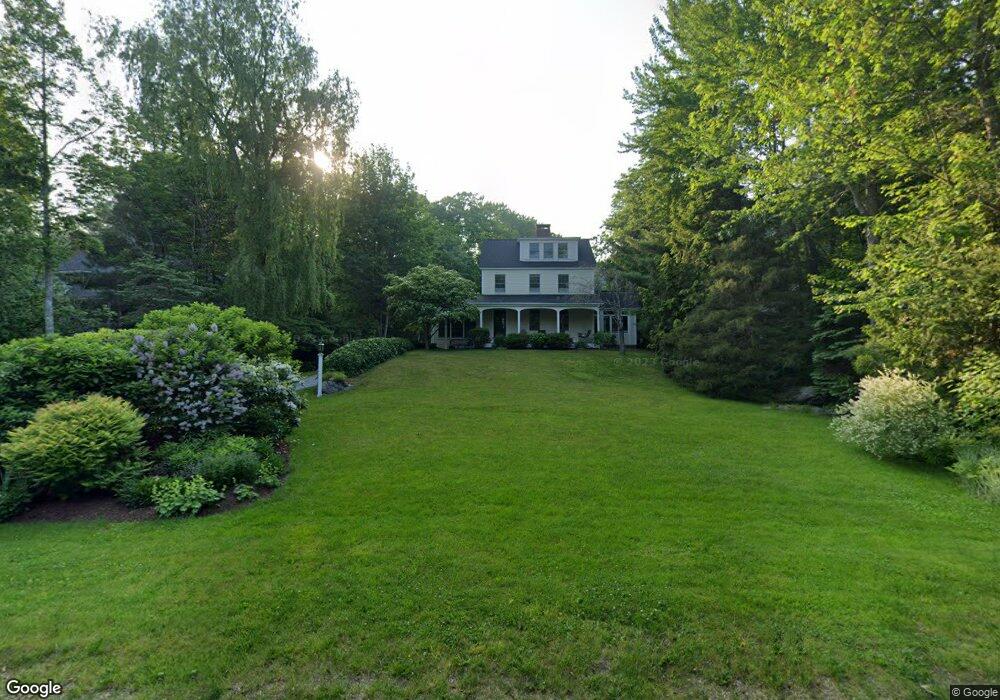
2 Norumbega Dr Camden, ME 04843
Estimated Value: $1,390,000 - $1,596,000
4
Beds
4
Baths
3,400
Sq Ft
$444/Sq Ft
Est. Value
About This Home
This home is located at 2 Norumbega Dr, Camden, ME 04843 and is currently estimated at $1,508,993, approximately $443 per square foot. 2 Norumbega Dr is a home located in Knox County with nearby schools including Camden-Rockport Elementary School, Camden-Rockport Middle School, and Camden Hills Regional High School.
Ownership History
Date
Name
Owned For
Owner Type
Purchase Details
Closed on
Jul 1, 2011
Sold by
Rowse Samuel B
Bought by
Warren Deborah N and Warren Peter G
Current Estimated Value
Home Financials for this Owner
Home Financials are based on the most recent Mortgage that was taken out on this home.
Original Mortgage
$412,750
Outstanding Balance
$285,430
Interest Rate
4.62%
Mortgage Type
Purchase Money Mortgage
Estimated Equity
$1,223,563
Create a Home Valuation Report for This Property
The Home Valuation Report is an in-depth analysis detailing your home's value as well as a comparison with similar homes in the area
Home Values in the Area
Average Home Value in this Area
Purchase History
| Date | Buyer | Sale Price | Title Company |
|---|---|---|---|
| Warren Deborah N | -- | -- |
Source: Public Records
Mortgage History
| Date | Status | Borrower | Loan Amount |
|---|---|---|---|
| Open | Warren Deborah N | $412,750 |
Source: Public Records
Tax History Compared to Growth
Tax History
| Year | Tax Paid | Tax Assessment Tax Assessment Total Assessment is a certain percentage of the fair market value that is determined by local assessors to be the total taxable value of land and additions on the property. | Land | Improvement |
|---|---|---|---|---|
| 2024 | $14,008 | $1,334,100 | $463,800 | $870,300 |
| 2023 | $12,319 | $892,700 | $196,100 | $696,600 |
| 2022 | $11,784 | $892,700 | $196,100 | $696,600 |
| 2021 | $10,819 | $704,800 | $231,100 | $473,700 |
| 2020 | $10,593 | $704,800 | $231,100 | $473,700 |
| 2019 | $10,509 | $704,800 | $231,100 | $473,700 |
| 2018 | $10,819 | $727,100 | $264,200 | $462,900 |
| 2017 | $10,456 | $727,100 | $264,200 | $462,900 |
| 2016 | $9,739 | $624,700 | $291,200 | $333,500 |
| 2015 | $9,452 | $624,700 | $291,200 | $333,500 |
| 2014 | $9,014 | $624,700 | $291,200 | $333,500 |
| 2013 | $8,771 | $624,700 | $291,200 | $333,500 |
Source: Public Records
Map
Nearby Homes