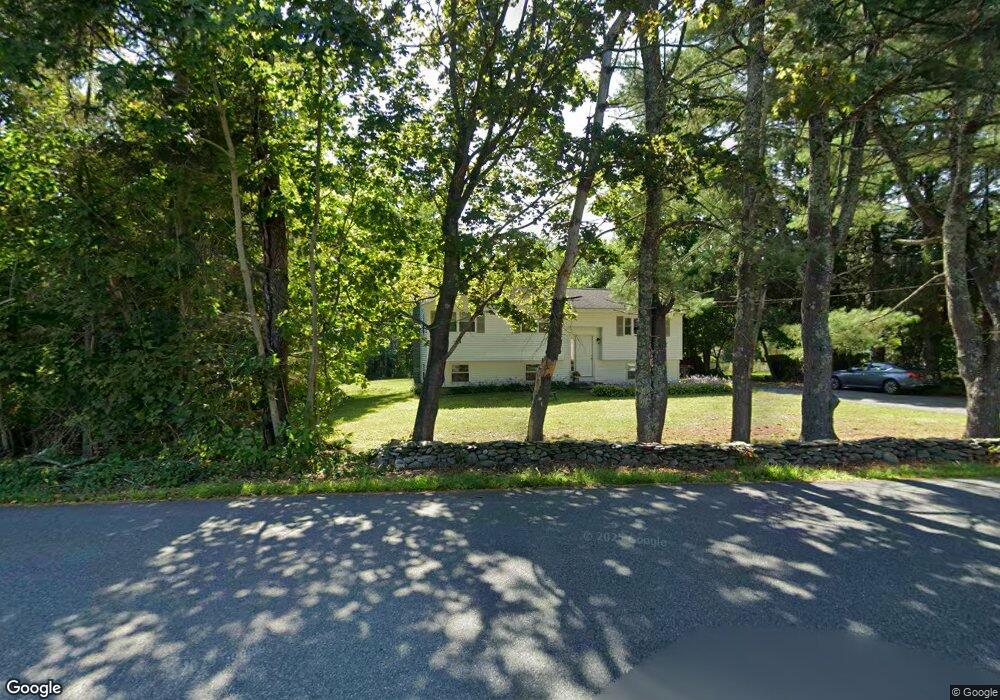
2 Oak Hill St Pepperell, MA 01463
Estimated Value: $446,000 - $523,000
4
Beds
1
Bath
1,245
Sq Ft
$392/Sq Ft
Est. Value
About This Home
This home is located at 2 Oak Hill St, Pepperell, MA 01463 and is currently estimated at $487,814, approximately $391 per square foot. 2 Oak Hill St is a home located in Middlesex County with nearby schools including North Middlesex Regional High School, Pepperell Christian Academy, and Maple Dene & Moppet School.
Ownership History
Date
Name
Owned For
Owner Type
Purchase Details
Closed on
Oct 12, 1993
Sold by
Brown Wendy L
Bought by
Hanna David P and Hanna Linda D
Current Estimated Value
Home Financials for this Owner
Home Financials are based on the most recent Mortgage that was taken out on this home.
Original Mortgage
$87,000
Interest Rate
6.9%
Mortgage Type
Purchase Money Mortgage
Purchase Details
Closed on
Nov 2, 1987
Sold by
Gauthier Rodny R
Bought by
Brown Wendy L
Create a Home Valuation Report for This Property
The Home Valuation Report is an in-depth analysis detailing your home's value as well as a comparison with similar homes in the area
Home Values in the Area
Average Home Value in this Area
Purchase History
| Date | Buyer | Sale Price | Title Company |
|---|---|---|---|
| Hanna David P | $99,000 | -- | |
| Brown Wendy L | $133,000 | -- |
Source: Public Records
Mortgage History
| Date | Status | Borrower | Loan Amount |
|---|---|---|---|
| Closed | Brown Wendy L | $87,000 | |
| Previous Owner | Brown Wendy L | $113,500 | |
| Previous Owner | Brown Wendy L | $20,000 | |
| Previous Owner | Brown Wendy L | $90,000 |
Source: Public Records
Tax History Compared to Growth
Tax History
| Year | Tax Paid | Tax Assessment Tax Assessment Total Assessment is a certain percentage of the fair market value that is determined by local assessors to be the total taxable value of land and additions on the property. | Land | Improvement |
|---|---|---|---|---|
| 2025 | $5,586 | $381,800 | $151,300 | $230,500 |
| 2024 | $5,086 | $354,400 | $138,100 | $216,300 |
| 2023 | $5,060 | $334,200 | $125,000 | $209,200 |
| 2022 | $4,855 | $283,100 | $111,800 | $171,300 |
| 2021 | $4,772 | $266,300 | $98,700 | $167,600 |
| 2020 | $12,207 | $266,300 | $98,700 | $167,600 |
| 2019 | $4,229 | $254,900 | $98,700 | $156,200 |
| 2018 | $3,904 | $238,200 | $98,700 | $139,500 |
| 2017 | $3,626 | $228,200 | $92,100 | $136,100 |
| 2016 | $3,465 | $209,600 | $92,100 | $117,500 |
| 2015 | $3,343 | $209,600 | $92,100 | $117,500 |
| 2014 | $3,250 | $204,900 | $92,100 | $112,800 |
Source: Public Records
Map
Nearby Homes
- 19 Sartelle St
- 97 Park St
- 16 Village Rd
- 46 Brookline St
- 2 Old Farm Ln
- 7 Blue Herons Way
- 25 Chace Ave
- 17 Chace Ave
- 7 Elm St
- 12 Chace Ave
- 3 Nashua Rd
- 18 Maple St
- 8 Tucker Park Unit D
- 10 Tucker St
- 22 River Rd
- 6 Mason St Unit 59
- 103 Main St Unit 23
- 179 Brookline St
- 38 River Rd Unit 11
- 38 Tarbell St Unit 5B