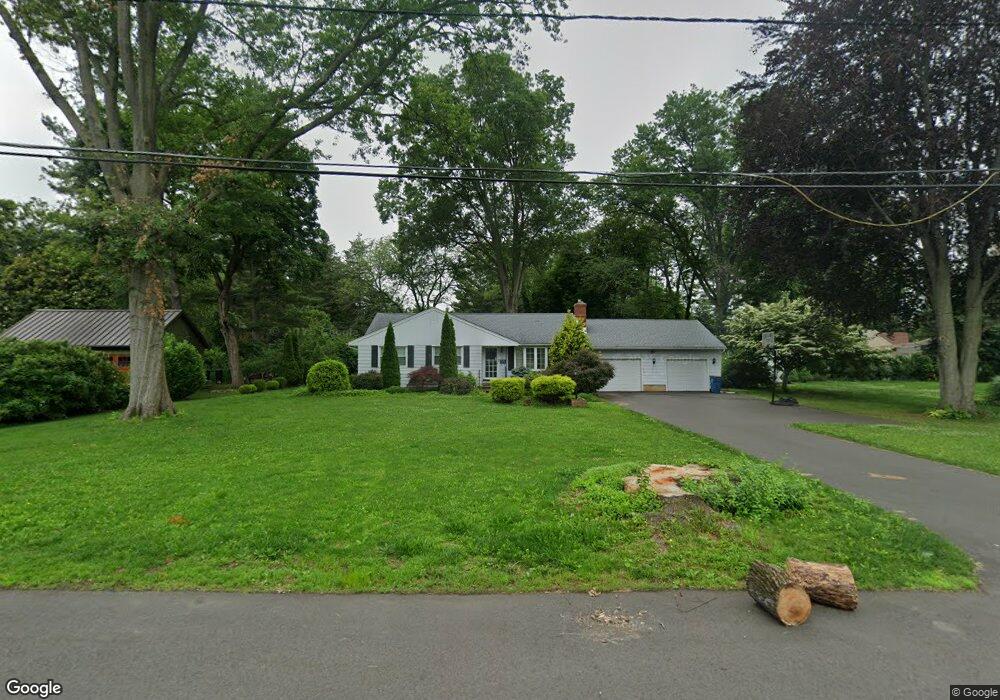
2 Oak Ln Cranbury, NJ 08512
Estimated Value: $746,487 - $956,000
--
Bed
--
Bath
1,935
Sq Ft
$441/Sq Ft
Est. Value
About This Home
This home is located at 2 Oak Ln, Cranbury, NJ 08512 and is currently estimated at $852,372, approximately $440 per square foot. 2 Oak Ln is a home located in Middlesex County with nearby schools including The Cranbury School, E Windsor Knowledge Beginnings, and SciCore Academy.
Ownership History
Date
Name
Owned For
Owner Type
Purchase Details
Closed on
Nov 21, 2017
Sold by
Buszko Darylee
Bought by
Lee Peter R and Lee Ji Sun
Current Estimated Value
Home Financials for this Owner
Home Financials are based on the most recent Mortgage that was taken out on this home.
Original Mortgage
$352,000
Outstanding Balance
$295,658
Interest Rate
3.94%
Mortgage Type
New Conventional
Estimated Equity
$556,714
Purchase Details
Closed on
May 17, 2005
Create a Home Valuation Report for This Property
The Home Valuation Report is an in-depth analysis detailing your home's value as well as a comparison with similar homes in the area
Home Values in the Area
Average Home Value in this Area
Purchase History
| Date | Buyer | Sale Price | Title Company |
|---|---|---|---|
| Lee Peter R | $440,000 | Title Village Title Agency L | |
| -- | $100 | -- |
Source: Public Records
Mortgage History
| Date | Status | Borrower | Loan Amount |
|---|---|---|---|
| Open | Lee Peter R | $352,000 |
Source: Public Records
Tax History Compared to Growth
Tax History
| Year | Tax Paid | Tax Assessment Tax Assessment Total Assessment is a certain percentage of the fair market value that is determined by local assessors to be the total taxable value of land and additions on the property. | Land | Improvement |
|---|---|---|---|---|
| 2025 | $7,977 | $448,600 | $227,300 | $221,300 |
| 2024 | $7,861 | $448,600 | $227,300 | $221,300 |
| 2023 | $7,861 | $448,600 | $227,300 | $221,300 |
| 2022 | $7,744 | $448,600 | $227,300 | $221,300 |
| 2021 | $5,822 | $448,600 | $227,300 | $221,300 |
| 2020 | $7,735 | $448,600 | $227,300 | $221,300 |
| 2019 | $8,070 | $448,600 | $227,300 | $221,300 |
| 2018 | $8,591 | $436,300 | $227,300 | $209,000 |
| 2017 | $9,233 | $494,700 | $227,300 | $267,400 |
| 2016 | $9,563 | $494,700 | $227,300 | $267,400 |
| 2015 | $9,139 | $494,700 | $227,300 | $267,400 |
| 2014 | $9,174 | $494,700 | $227,300 | $267,400 |
Source: Public Records
Map
Nearby Homes