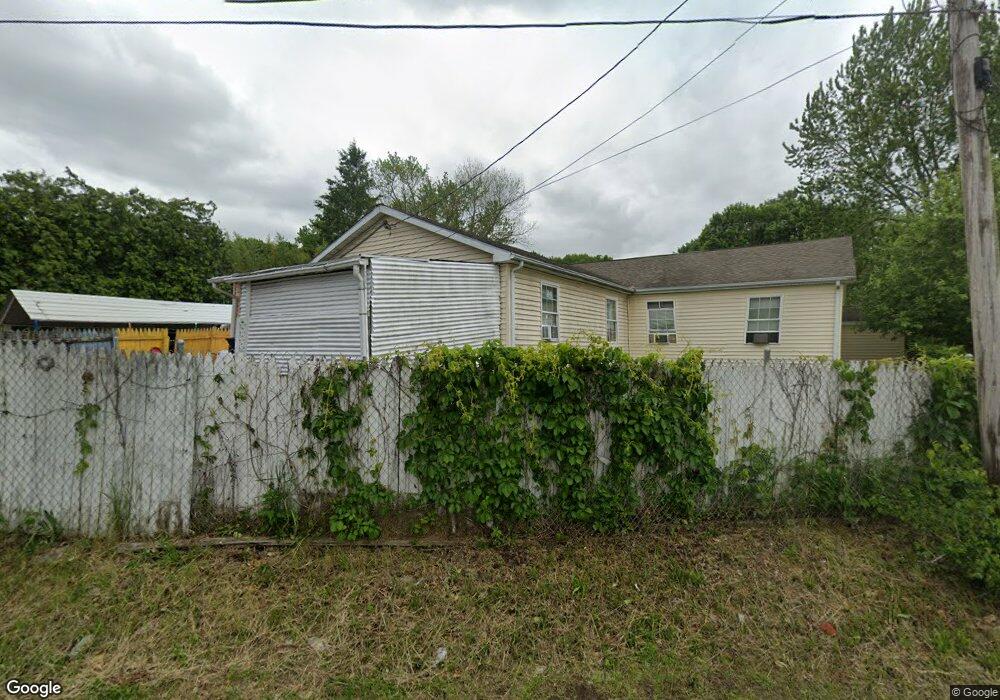
2 Ophelia St Providence, RI 02909
Hartford NeighborhoodEstimated Value: $441,000 - $586,000
5
Beds
3
Baths
1,808
Sq Ft
$280/Sq Ft
Est. Value
About This Home
This home is located at 2 Ophelia St, Providence, RI 02909 and is currently estimated at $506,105, approximately $279 per square foot. 2 Ophelia St is a home located in Providence County with nearby schools including Achievement First Promesa, Achievement First Providence Mayoral Academy Elementary School, and Achievement First Providence Mayoral Academy Elementary.
Ownership History
Date
Name
Owned For
Owner Type
Purchase Details
Closed on
Jun 16, 2025
Sold by
Demendez Rosa C and Mendez Mario F
Bought by
Mario & Rosa Mendez Lt and Mendez
Current Estimated Value
Purchase Details
Closed on
Sep 13, 2004
Sold by
Mazzenga Gino A
Bought by
Demendez Rosa Cruz
Create a Home Valuation Report for This Property
The Home Valuation Report is an in-depth analysis detailing your home's value as well as a comparison with similar homes in the area
Home Values in the Area
Average Home Value in this Area
Purchase History
| Date | Buyer | Sale Price | Title Company |
|---|---|---|---|
| Mario & Rosa Mendez Lt | -- | None Available | |
| Mario & Rosa Mendez Lt | -- | None Available | |
| Mario & Rosa Mendez Lt | -- | None Available | |
| Demendez Rosa Cruz | $100,000 | -- | |
| Demendez Rosa Cruz | $100,000 | -- |
Source: Public Records
Mortgage History
| Date | Status | Borrower | Loan Amount |
|---|---|---|---|
| Previous Owner | Demendez Rosa Cruz | $289,000 |
Source: Public Records
Tax History
| Year | Tax Paid | Tax Assessment Tax Assessment Total Assessment is a certain percentage of the fair market value that is determined by local assessors to be the total taxable value of land and additions on the property. | Land | Improvement |
|---|---|---|---|---|
| 2025 | $4,014 | $477,800 | $150,000 | $327,800 |
| 2024 | $6,896 | $375,800 | $94,900 | $280,900 |
| 2023 | $6,896 | $375,800 | $94,900 | $280,900 |
| 2022 | $6,689 | $375,800 | $94,900 | $280,900 |
| 2021 | $6,764 | $275,400 | $61,600 | $213,800 |
| 2020 | $6,764 | $275,400 | $61,600 | $213,800 |
| 2019 | $6,764 | $275,400 | $61,600 | $213,800 |
| 2018 | $6,402 | $200,300 | $52,400 | $147,900 |
| 2017 | $6,402 | $200,300 | $52,400 | $147,900 |
| 2016 | $6,402 | $200,300 | $52,400 | $147,900 |
| 2015 | $5,994 | $181,100 | $52,400 | $128,700 |
| 2014 | $6,112 | $181,100 | $52,400 | $128,700 |
| 2013 | $6,112 | $181,100 | $52,400 | $128,700 |
Source: Public Records
Map
Nearby Homes
- 236 Lowell Ave
- 231 Lowell Ave
- 60 Ophelia St
- 665 Plainfield St
- 27 Aurelia Dr
- 0 Central Ave Unit 1398155
- 10 Mott St
- 162 Merino St
- 102 Ophelia St
- 18 Crowninshield St
- 15 Melissa St
- 240 Eastwood Ave
- 0 Orchard St Unit 1396400
- 0 Orchard St Unit 1400488
- 0 Orchard St Unit 1395201
- 17 Middleton St
- 140 Cleveland St
- 29 Matson Ave Unit 4D
- 129 Glenbridge Ave
- 33 Harding Ave