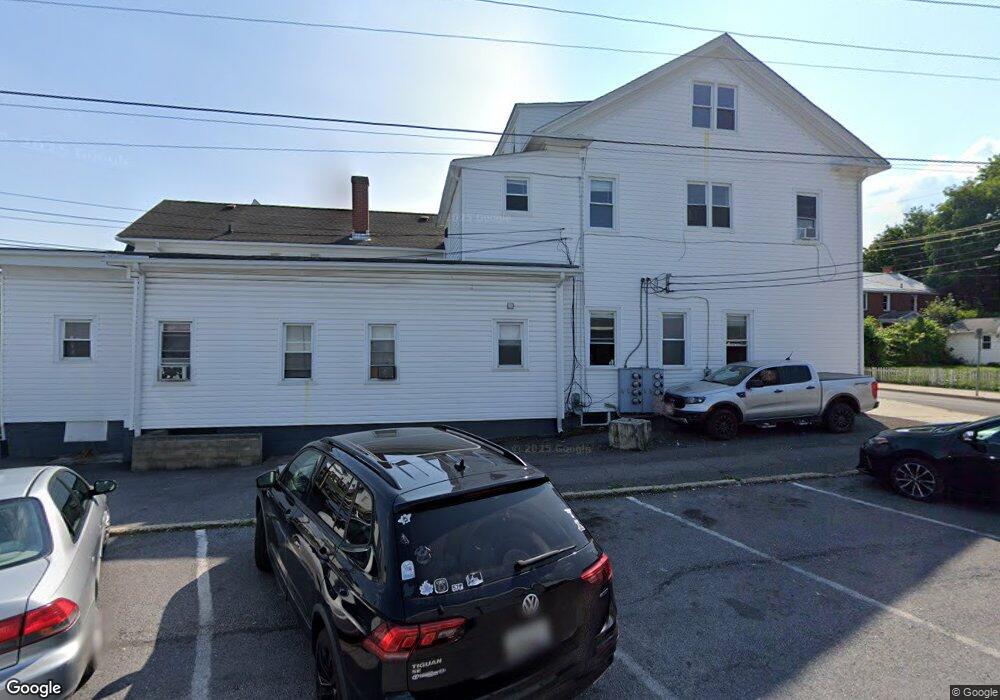
2 Ormand St Frostburg, MD 21532
Estimated Value: $83,000 - $119,000
Studio
1
Bath
1,308
Sq Ft
$78/Sq Ft
Est. Value
About This Home
This home is located at 2 Ormand St, Frostburg, MD 21532 and is currently estimated at $102,468, approximately $78 per square foot. 2 Ormand St is a home located in Allegany County with nearby schools including Beall Elementary School, Mount Savage Middle School, and Mountain Ridge High School.
Ownership History
Date
Name
Owned For
Owner Type
Purchase Details
Closed on
Dec 30, 2013
Sold by
Hunter Joann
Bought by
Mckenzie Lori Ann
Current Estimated Value
Purchase Details
Closed on
May 4, 2012
Sold by
Hunter Charles W and Hunter Joann
Bought by
Hunter Charles W and Hunter Charles W
Purchase Details
Closed on
Nov 19, 2003
Sold by
Hunter Charles W
Bought by
Hunter Charles W and Hunter Joann
Purchase Details
Closed on
Oct 25, 1996
Sold by
Lemmert Emma D and Lemmert Robert William
Bought by
Hunter Charles W
Create a Home Valuation Report for This Property
The Home Valuation Report is an in-depth analysis detailing your home's value as well as a comparison with similar homes in the area
Home Values in the Area
Average Home Value in this Area
Purchase History
| Date | Buyer | Sale Price | Title Company |
|---|---|---|---|
| Mckenzie Lori Ann | -- | None Available | |
| Hunter Charles W | -- | None Available | |
| Hunter Charles W | -- | -- | |
| Hunter Charles W | $76,000 | -- |
Source: Public Records
Mortgage History
| Date | Status | Borrower | Loan Amount |
|---|---|---|---|
| Closed | Hunter Charles W | -- |
Source: Public Records
Tax History
| Year | Tax Paid | Tax Assessment Tax Assessment Total Assessment is a certain percentage of the fair market value that is determined by local assessors to be the total taxable value of land and additions on the property. | Land | Improvement |
|---|---|---|---|---|
| 2025 | $792 | $77,900 | $12,000 | $65,900 |
| 2024 | $747 | $72,367 | $0 | $0 |
| 2023 | $675 | $66,833 | $0 | $0 |
| 2022 | $620 | $61,300 | $12,000 | $49,300 |
| 2021 | $623 | $61,267 | $0 | $0 |
| 2020 | $601 | $61,233 | $0 | $0 |
| 2019 | $606 | $61,200 | $12,000 | $49,200 |
| 2018 | $614 | $61,200 | $12,000 | $49,200 |
| 2017 | $609 | $61,200 | $0 | $0 |
| 2016 | $0 | $62,600 | $0 | $0 |
| 2015 | $613 | $62,600 | $0 | $0 |
| 2014 | $613 | $62,600 | $0 | $0 |
Source: Public Records
Map
Nearby Homes
Your Personal Tour Guide
Ask me questions while you tour the home.