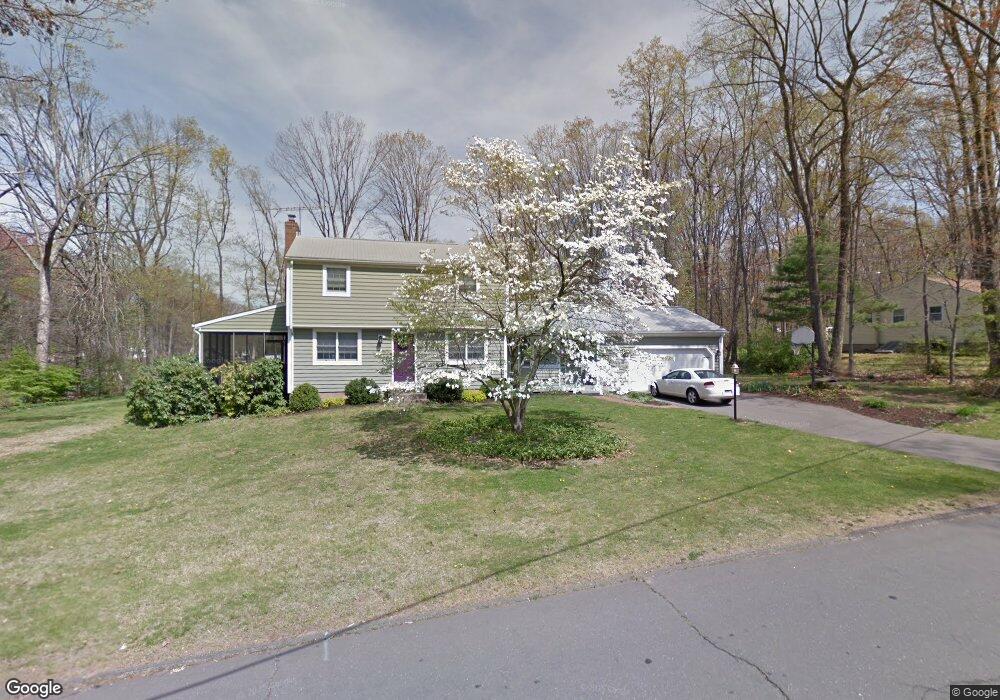
2 Overhill Rd Ellington, CT 06029
Estimated Value: $415,000 - $469,000
4
Beds
2
Baths
1,853
Sq Ft
$238/Sq Ft
Est. Value
About This Home
This home is located at 2 Overhill Rd, Ellington, CT 06029 and is currently estimated at $441,451, approximately $238 per square foot. 2 Overhill Rd is a home located in Tolland County with nearby schools including Ellington High School.
Ownership History
Date
Name
Owned For
Owner Type
Purchase Details
Closed on
Aug 27, 2003
Sold by
Hooper Saran
Bought by
Meaney Daniel and Meaney Helen
Current Estimated Value
Home Financials for this Owner
Home Financials are based on the most recent Mortgage that was taken out on this home.
Original Mortgage
$182,800
Outstanding Balance
$81,581
Interest Rate
5.69%
Estimated Equity
$359,870
Purchase Details
Closed on
Nov 4, 2002
Sold by
Bunick Philip and Bunick Carolyn
Bought by
Hooper Sarah
Home Financials for this Owner
Home Financials are based on the most recent Mortgage that was taken out on this home.
Original Mortgage
$175,920
Interest Rate
6.09%
Create a Home Valuation Report for This Property
The Home Valuation Report is an in-depth analysis detailing your home's value as well as a comparison with similar homes in the area
Home Values in the Area
Average Home Value in this Area
Purchase History
| Date | Buyer | Sale Price | Title Company |
|---|---|---|---|
| Meaney Daniel | $228,500 | -- | |
| Hooper Sarah | $219,900 | -- |
Source: Public Records
Mortgage History
| Date | Status | Borrower | Loan Amount |
|---|---|---|---|
| Open | Hooper Sarah | $75,000 | |
| Open | Hooper Sarah | $182,800 | |
| Previous Owner | Hooper Sarah | $175,920 | |
| Previous Owner | Hooper Sarah | $102,000 |
Source: Public Records
Tax History
| Year | Tax Paid | Tax Assessment Tax Assessment Total Assessment is a certain percentage of the fair market value that is determined by local assessors to be the total taxable value of land and additions on the property. | Land | Improvement |
|---|---|---|---|---|
| 2025 | $6,504 | $175,320 | $57,910 | $117,410 |
| 2024 | $6,312 | $175,320 | $57,910 | $117,410 |
| 2023 | $6,013 | $175,320 | $57,910 | $117,410 |
| 2022 | $5,698 | $175,320 | $57,910 | $117,410 |
| 2021 | $5,540 | $175,320 | $57,910 | $117,410 |
| 2020 | $5,533 | $169,730 | $57,550 | $112,180 |
| 2019 | $5,533 | $169,730 | $57,550 | $112,180 |
| 2016 | $5,118 | $167,790 | $57,550 | $110,240 |
| 2015 | $5,118 | $170,860 | $57,550 | $113,310 |
| 2014 | $4,904 | $170,860 | $57,550 | $113,310 |
Source: Public Records
Map
Nearby Homes
- 33 Lanz Ln
- 254 Jobs Hill Rd
- 437 Somers Rd
- 37 Ellsworth Ln
- 0 Porter Rd
- 96 Muddy Brook Rd
- 43 Jamestown Rd
- 58 Maple St
- 89 Maple St
- 41 Cider Mill Rd
- 178 Crystal Lake Rd
- 0000 Webster Rd
- 969 Main St
- 138 Main St
- 20 Shaker Rd
- 283 Mountain View Rd
- 89 Crystal Lake Rd Unit T7
- 3 Meagan Cir
- 10 Bailey Rd
- 6 Setting Sun Trail
Your Personal Tour Guide
Ask me questions while you tour the home.