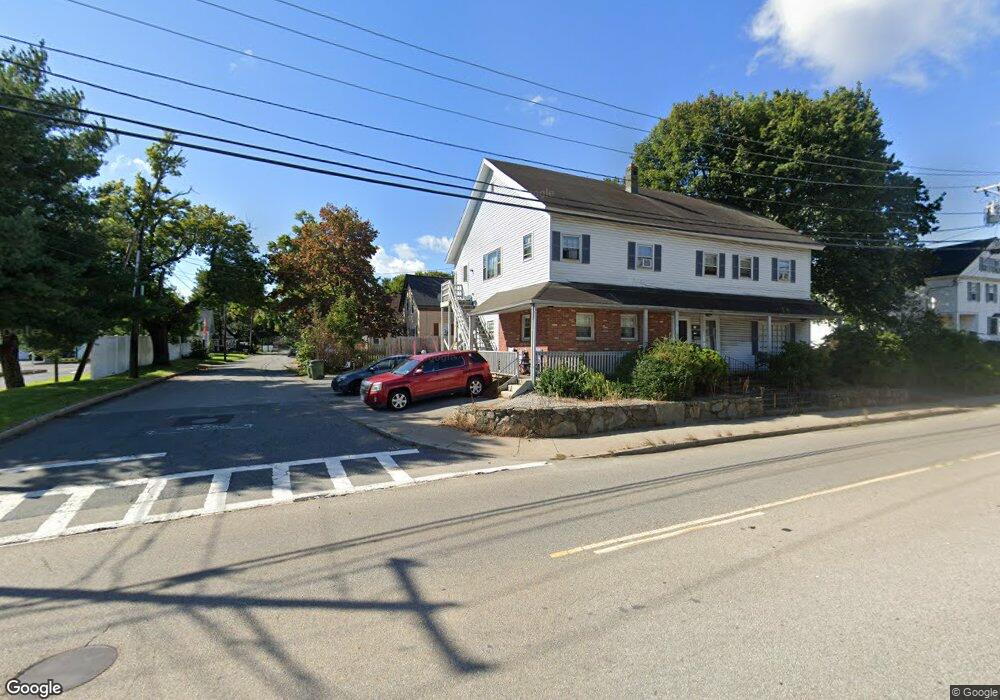
2 Park St Oxford, MA 01540
Estimated Value: $336,299 - $438,000
5
Beds
1
Bath
1,422
Sq Ft
$280/Sq Ft
Est. Value
About This Home
This home is located at 2 Park St, Oxford, MA 01540 and is currently estimated at $398,325, approximately $280 per square foot. 2 Park St is a home located in Worcester County with nearby schools including Alfred M Chaffee, Oxford High School, and Clara Barton Elementary School.
Ownership History
Date
Name
Owned For
Owner Type
Purchase Details
Closed on
Feb 24, 2023
Sold by
Carey Sean M
Bought by
Carey Sean M and Carey Kathleen R
Current Estimated Value
Purchase Details
Closed on
Oct 17, 1986
Bought by
Carey Sean M and Carey Kathleen R
Create a Home Valuation Report for This Property
The Home Valuation Report is an in-depth analysis detailing your home's value as well as a comparison with similar homes in the area
Home Values in the Area
Average Home Value in this Area
Purchase History
| Date | Buyer | Sale Price | Title Company |
|---|---|---|---|
| Carey Sean M | -- | None Available | |
| Carey Sean M | -- | None Available | |
| Carey Sean M | $89,000 | -- |
Source: Public Records
Mortgage History
| Date | Status | Borrower | Loan Amount |
|---|---|---|---|
| Previous Owner | Carey Sean M | $80,500 | |
| Previous Owner | Carey Sean M | $66,150 | |
| Previous Owner | Carey Sean M | $47,000 |
Source: Public Records
Tax History
| Year | Tax Paid | Tax Assessment Tax Assessment Total Assessment is a certain percentage of the fair market value that is determined by local assessors to be the total taxable value of land and additions on the property. | Land | Improvement |
|---|---|---|---|---|
| 2025 | $36 | $287,100 | $72,700 | $214,400 |
| 2024 | $3,512 | $260,500 | $67,500 | $193,000 |
| 2023 | $3,510 | $257,300 | $60,300 | $197,000 |
| 2022 | $3,366 | $208,300 | $58,600 | $149,700 |
| 2021 | $3,142 | $190,100 | $55,600 | $134,500 |
| 2020 | $2,920 | $175,300 | $55,600 | $119,700 |
| 2019 | $2,638 | $154,900 | $55,600 | $99,300 |
| 2018 | $2,675 | $154,900 | $55,600 | $99,300 |
| 2017 | $2,689 | $159,600 | $55,600 | $104,000 |
| 2016 | $2,702 | $159,600 | $55,600 | $104,000 |
| 2015 | $2,520 | $159,600 | $55,600 | $104,000 |
| 2014 | $2,489 | $165,900 | $55,600 | $110,300 |
Source: Public Records
Map
Nearby Homes
Your Personal Tour Guide
Ask me questions while you tour the home.