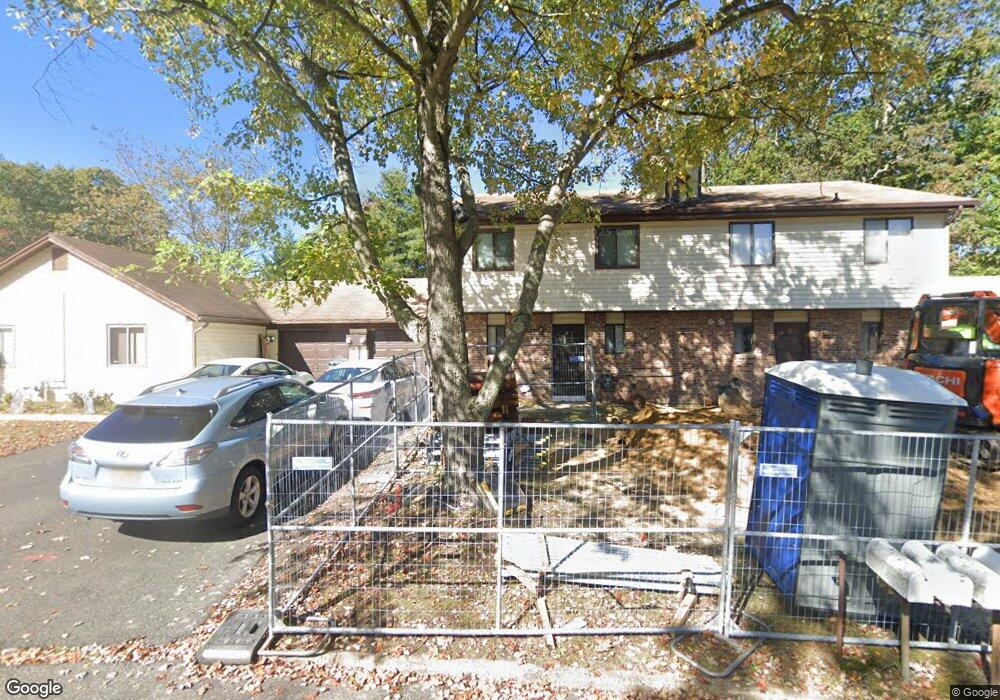
2 Peacock Place Unit 1000 Howell, NJ 07731
Candlewood NeighborhoodEstimated Value: $392,000 - $415,000
2
Beds
2
Baths
1,276
Sq Ft
$313/Sq Ft
Est. Value
About This Home
This home is located at 2 Peacock Place Unit 1000, Howell, NJ 07731 and is currently estimated at $399,966, approximately $313 per square foot. 2 Peacock Place Unit 1000 is a home located in Monmouth County with nearby schools including Taunton School, Aldrich School, and Howell Township Middle School South.
Ownership History
Date
Name
Owned For
Owner Type
Purchase Details
Closed on
Aug 27, 2021
Sold by
Schiera Properties Llc
Bought by
Portera Stephanie
Current Estimated Value
Home Financials for this Owner
Home Financials are based on the most recent Mortgage that was taken out on this home.
Original Mortgage
$195,000
Outstanding Balance
$177,171
Interest Rate
2.7%
Mortgage Type
New Conventional
Estimated Equity
$222,795
Purchase Details
Closed on
Jun 24, 2021
Sold by
Smith Brian
Bought by
Schiera Properties Llc
Home Financials for this Owner
Home Financials are based on the most recent Mortgage that was taken out on this home.
Interest Rate
3.02%
Purchase Details
Closed on
Mar 31, 2021
Sold by
Smith Brian
Bought by
Sahiera Properties Llc
Purchase Details
Closed on
Aug 26, 2019
Sold by
Torrado Bonnie Lubalin and Smith Bonnie
Bought by
Smith Brain
Create a Home Valuation Report for This Property
The Home Valuation Report is an in-depth analysis detailing your home's value as well as a comparison with similar homes in the area
Home Values in the Area
Average Home Value in this Area
Purchase History
| Date | Buyer | Sale Price | Title Company |
|---|---|---|---|
| Portera Stephanie | $275,000 | Lt National Title Svcs Inc | |
| Portera Stephanie | $275,000 | National Title | |
| Schiera Properties Llc | $147,500 | -- | |
| Sahiera Properties Llc | $147,500 | Foundation Title Llc | |
| Schiera Properties Llc | $147,500 | Foundation Title | |
| Smith Brain | -- | None Available |
Source: Public Records
Mortgage History
| Date | Status | Borrower | Loan Amount |
|---|---|---|---|
| Open | Portera Stephanie | $195,000 | |
| Closed | Portera Stephanie | $195,000 | |
| Previous Owner | Schiera Properties Llc | -- |
Source: Public Records
Tax History Compared to Growth
Tax History
| Year | Tax Paid | Tax Assessment Tax Assessment Total Assessment is a certain percentage of the fair market value that is determined by local assessors to be the total taxable value of land and additions on the property. | Land | Improvement |
|---|---|---|---|---|
| 2025 | $6,381 | $418,700 | $200,000 | $218,700 |
| 2024 | $6,381 | $364,800 | $200,000 | $164,800 |
| 2023 | $6,381 | $342,900 | $182,000 | $160,900 |
| 2022 | $4,506 | $265,200 | $112,000 | $153,200 |
| 2021 | $4,506 | $196,300 | $105,000 | $91,300 |
| 2020 | $4,786 | $206,100 | $105,000 | $101,100 |
| 2019 | $4,356 | $184,100 | $84,800 | $99,300 |
| 2018 | $4,160 | $174,700 | $80,000 | $94,700 |
| 2017 | $3,896 | $161,800 | $70,000 | $91,800 |
| 2016 | $3,393 | $139,500 | $50,000 | $89,500 |
| 2015 | $3,160 | $128,600 | $41,400 | $87,200 |
| 2014 | $3,347 | $126,400 | $51,500 | $74,900 |
Source: Public Records
Map
Nearby Homes
- 2 Peacock Place
- 3 Peacock Place
- 3 Peacock Place Unit 1000
- 1 Peacock Place
- 4 Peacock Place
- 5 Peacock Place
- 5 Peacock Place Unit 1000
- 1 Stork Ln
- 16 Peacock Place
- 2 Stork Ln
- 6 Peacock Place
- 15 Peacock Place Unit 15
- 15 Peacock Place Unit 1000
- 7 Peacock Place
- 7 Peacock Place Unit 1000
- 3 Stork Ln
- 14 Peacock Place
- 13 Peacock Place
- 4 Stork Ln
- 13 Pheasant Place