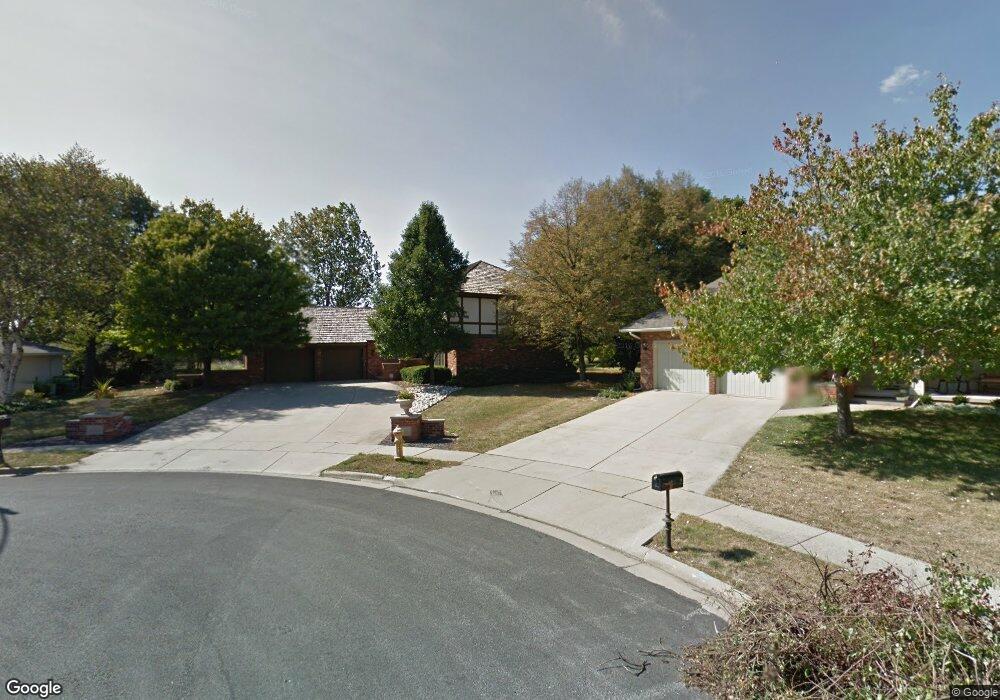
2 Pendleton Way Bloomington, IL 61704
Estimated Value: $416,455 - $434,000
5
Beds
4
Baths
4,224
Sq Ft
$101/Sq Ft
Est. Value
About This Home
This home is located at 2 Pendleton Way, Bloomington, IL 61704 and is currently estimated at $428,114, approximately $101 per square foot. 2 Pendleton Way is a home located in McLean County with nearby schools including Oakland Elementary School, Bloomington Junior High School, and Bloomington High School.
Ownership History
Date
Name
Owned For
Owner Type
Purchase Details
Closed on
Oct 6, 2011
Sold by
Hubbard Donald and Hubbard Katherine
Bought by
Hundman Thomas M and Hundman Lyndi J
Current Estimated Value
Home Financials for this Owner
Home Financials are based on the most recent Mortgage that was taken out on this home.
Original Mortgage
$239,600
Outstanding Balance
$163,338
Interest Rate
4.09%
Estimated Equity
$264,776
Purchase Details
Closed on
Jun 20, 2007
Sold by
Hundman Mary C
Bought by
Hundman Katherine T
Home Financials for this Owner
Home Financials are based on the most recent Mortgage that was taken out on this home.
Original Mortgage
$224,000
Interest Rate
6.54%
Purchase Details
Closed on
Dec 14, 2005
Sold by
Turner Mercer
Bought by
Luther Katherine
Home Financials for this Owner
Home Financials are based on the most recent Mortgage that was taken out on this home.
Original Mortgage
$24,000
Interest Rate
6.48%
Create a Home Valuation Report for This Property
The Home Valuation Report is an in-depth analysis detailing your home's value as well as a comparison with similar homes in the area
Purchase History
| Date | Buyer | Sale Price | Title Company |
|---|---|---|---|
| Hundman Thomas M | $299,500 | None Available | |
| Hundman Katherine T | $280,000 | None Available | |
| Luther Katherine | -- | None Available |
Source: Public Records
Mortgage History
| Date | Status | Borrower | Loan Amount |
|---|---|---|---|
| Open | Hundman Thomas M | $239,600 | |
| Previous Owner | Hundman Katherine T | $224,000 | |
| Previous Owner | Luther Katherine | $24,000 |
Source: Public Records
Tax History
| Year | Tax Paid | Tax Assessment Tax Assessment Total Assessment is a certain percentage of the fair market value that is determined by local assessors to be the total taxable value of land and additions on the property. | Land | Improvement |
|---|---|---|---|---|
| 2024 | $8,248 | $119,980 | $35,612 | $84,368 |
| 2022 | $8,248 | $103,051 | $30,587 | $72,464 |
| 2021 | $7,583 | $95,231 | $28,266 | $66,965 |
| 2020 | $7,563 | $95,231 | $28,266 | $66,965 |
| 2019 | $7,726 | $97,423 | $28,917 | $68,506 |
| 2018 | $7,905 | $99,921 | $29,658 | $70,263 |
| 2017 | $7,907 | $99,921 | $29,658 | $70,263 |
| 2016 | $8,013 | $101,340 | $30,079 | $71,261 |
| 2015 | $7,878 | $100,000 | $29,681 | $70,319 |
| 2014 | $7,627 | $100,000 | $29,681 | $70,319 |
| 2013 | -- | $98,745 | $28,512 | $70,233 |
Source: Public Records
Map
Nearby Homes
- 1509 Beckenham Dr
- 1114 Andover St
- 1612 Myra Ln
- 34 Downing Cir
- 1727 Eide Rd
- 6 Stonebrook Ct
- 2204 E Lincoln St Unit 13
- 2211 Benjamin Ln Unit 1
- 47 Stonebrook Ct
- 1307 Longford Ln
- 29 Brookstone Cir
- 41 Brookstone Cir
- 2306 Maysel St
- 807 Verkler Ct
- 4 Scofield Ct
- 1010 Arlene Ct Unit 15
- 3 Harvest Ct
- 207 Hampton Dr
- 802 S Mercer Ave
- 317 Waterford Estates Dr
Your Personal Tour Guide
Ask me questions while you tour the home.