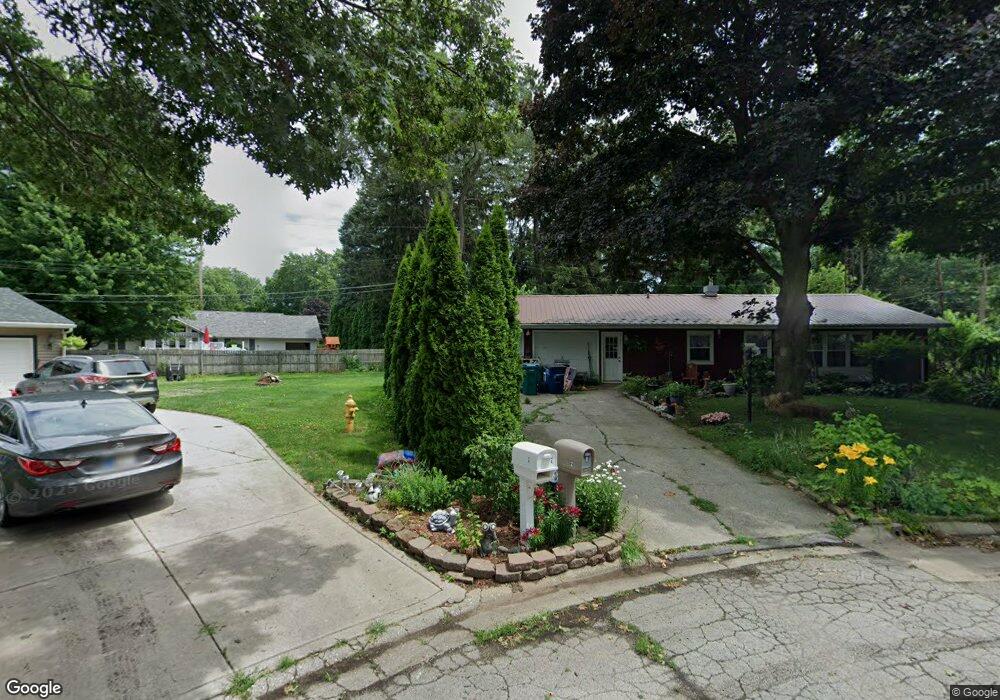
2 Phil Ct La Porte, IN 46350
Estimated Value: $181,000 - $197,000
3
Beds
2
Baths
1,189
Sq Ft
$159/Sq Ft
Est. Value
About This Home
This home is located at 2 Phil Ct, La Porte, IN 46350 and is currently estimated at $189,459, approximately $159 per square foot. 2 Phil Ct is a home located in LaPorte County with nearby schools including Handley Elementary School, La Porte High School, and Kesling Intermediate School.
Ownership History
Date
Name
Owned For
Owner Type
Purchase Details
Closed on
Jun 13, 2022
Sold by
Cannon Marc P
Bought by
Birtch St Holdings Llc
Current Estimated Value
Purchase Details
Closed on
Feb 6, 2018
Sold by
Cannon Alicia A and Cannon Marc P
Bought by
Cannon Marc P
Home Financials for this Owner
Home Financials are based on the most recent Mortgage that was taken out on this home.
Original Mortgage
$66,000
Interest Rate
4.22%
Mortgage Type
New Conventional
Purchase Details
Closed on
Nov 30, 2017
Sold by
Cannon Barbara A
Bought by
Cannon Marc P and Cannon Alica A
Create a Home Valuation Report for This Property
The Home Valuation Report is an in-depth analysis detailing your home's value as well as a comparison with similar homes in the area
Home Values in the Area
Average Home Value in this Area
Purchase History
| Date | Buyer | Sale Price | Title Company |
|---|---|---|---|
| Birtch St Holdings Llc | -- | None Listed On Document | |
| Cannon Marc P | -- | None Available | |
| Cannon Marc P | -- | None Available |
Source: Public Records
Mortgage History
| Date | Status | Borrower | Loan Amount |
|---|---|---|---|
| Previous Owner | Cannon Marc P | $66,000 |
Source: Public Records
Tax History
| Year | Tax Paid | Tax Assessment Tax Assessment Total Assessment is a certain percentage of the fair market value that is determined by local assessors to be the total taxable value of land and additions on the property. | Land | Improvement |
|---|---|---|---|---|
| 2025 | $2,021 | $91,400 | $23,400 | $68,000 |
| 2024 | $1,333 | $143,700 | $38,100 | $105,600 |
| 2022 | $1,254 | $62,700 | $16,700 | $46,000 |
| 2021 | $1,088 | $54,400 | $15,500 | $38,900 |
| 2020 | $1,088 | $54,400 | $14,000 | $40,400 |
| 2019 | $776 | $36,400 | $9,400 | $27,000 |
| 2018 | $804 | $37,800 | $9,400 | $28,400 |
| 2017 | $648 | $84,500 | $22,000 | $62,500 |
| 2016 | $1,516 | $73,400 | $27,000 | $46,400 |
| 2014 | $1,649 | $82,300 | $27,000 | $55,300 |
Source: Public Records
Map
Nearby Homes
Your Personal Tour Guide
Ask me questions while you tour the home.