2 Philips Rd Stoneham, MA 02180
Haywardville NeighborhoodEstimated Value: $732,000 - $997,000
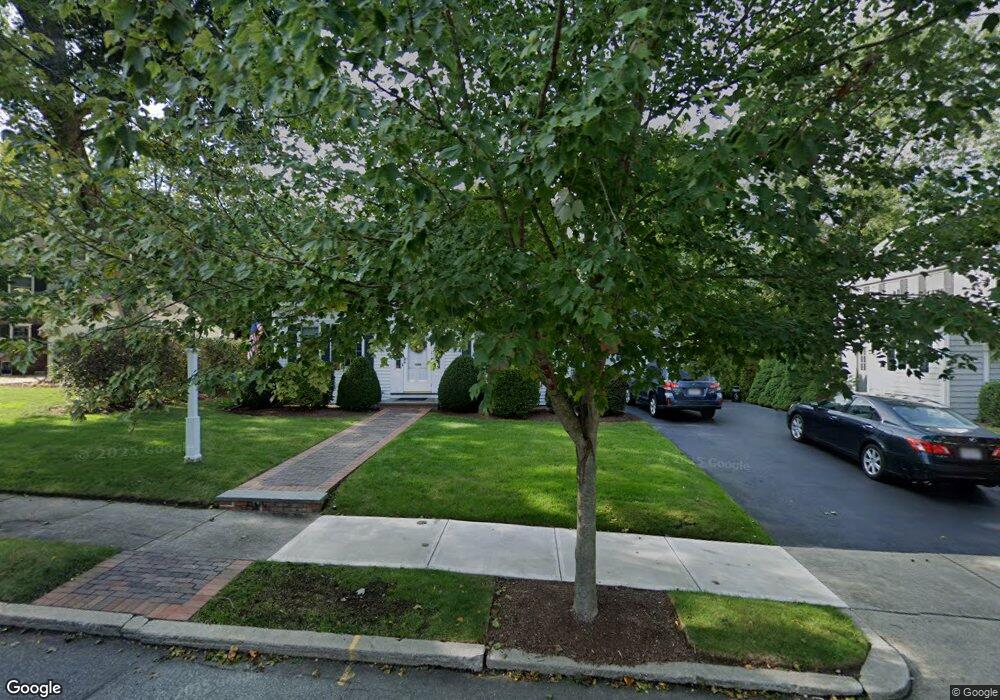
About This Home
This home is located at 2 Philips Rd, Stoneham, MA 02180 and is currently estimated at $886,926, approximately $453 per square foot. 2 Philips Rd is a home located in Middlesex County with nearby schools including Stoneham High School, St Mary's School, and Melrose Montessori School.
Ownership History
We collect this data history from publicly available records. To have your information removed, we recommend requesting removal directly through your county’s website.
Purchase Details
Purchase Details
Home Values in the Area
Average Home Value in this Area
Purchase History
We collect this data history from publicly available records. To have your information removed, we recommend requesting removal directly through your county’s website.
| Date | Buyer | Sale Price | Title Company |
|---|---|---|---|
| -- | -- | ||
| $96,000 | -- |
Mortgage History
We collect this data history from publicly available records. To have your information removed, we recommend requesting removal directly through your county’s website.
| Date | Status | Borrower | Loan Amount |
|---|---|---|---|
| Previous Owner | $100,000 | ||
| Previous Owner | $75,000 | ||
| Previous Owner | $30,000 |
Tax History
We collect this data history from publicly available records. To have your information removed, we recommend requesting removal directly through your county’s website.
| Year | Tax Paid | Tax Assessment Tax Assessment Total Assessment is a certain percentage of the fair market value that is determined by local assessors to be the total taxable value of land and additions on the property. | Land | Improvement |
|---|---|---|---|---|
| 2025 | $7,458 | $729,000 | $440,100 | $288,900 |
| 2024 | $7,064 | $667,000 | $400,100 | $266,900 |
| 2023 | $6,769 | $609,800 | $360,100 | $249,700 |
| 2022 | $5,959 | $572,400 | $340,100 | $232,300 |
| 2021 | $10,530 | $556,800 | $330,100 | $226,700 |
| 2020 | $5,267 | $553,000 | $320,100 | $232,900 |
| 2019 | $6,116 | $545,100 | $320,100 | $225,000 |
| 2018 | $5,319 | $535,900 | $300,100 | $235,800 |
| 2017 | $6,186 | $499,300 | $290,100 | $209,200 |
| 2016 | $6,076 | $478,400 | $280,100 | $198,300 |
| 2015 | $5,447 | $420,300 | $240,100 | $180,200 |
| 2014 | $5,544 | $411,000 | $230,100 | $180,900 |
Map
- 295 W Wyoming Ave Unit 7B
- 200 Park Terrace Dr Unit 245
- 1 Ravine Terrace Unit 1
- 410 Fellsview Terrace Unit 415
- 63 Florence St
- 11 Executive Dr Unit 113
- 97 Trenton St
- 51 Lynn Fells Pkwy
- 110 Crescent Ave
- 38-40 Hurd St
- 35 Frances St
- 18-20 N High St
- 509 Pleasant St Unit 1-4
- 47 S High St
- 6 Black Rock Rd
- 26 W Wyoming Ave Unit 2D
- 242 Pleasant St
- 185 Essex St Unit 1A
- 340 Main St Unit 606
- 171 Derby Rd
Ask me questions while you tour the home.