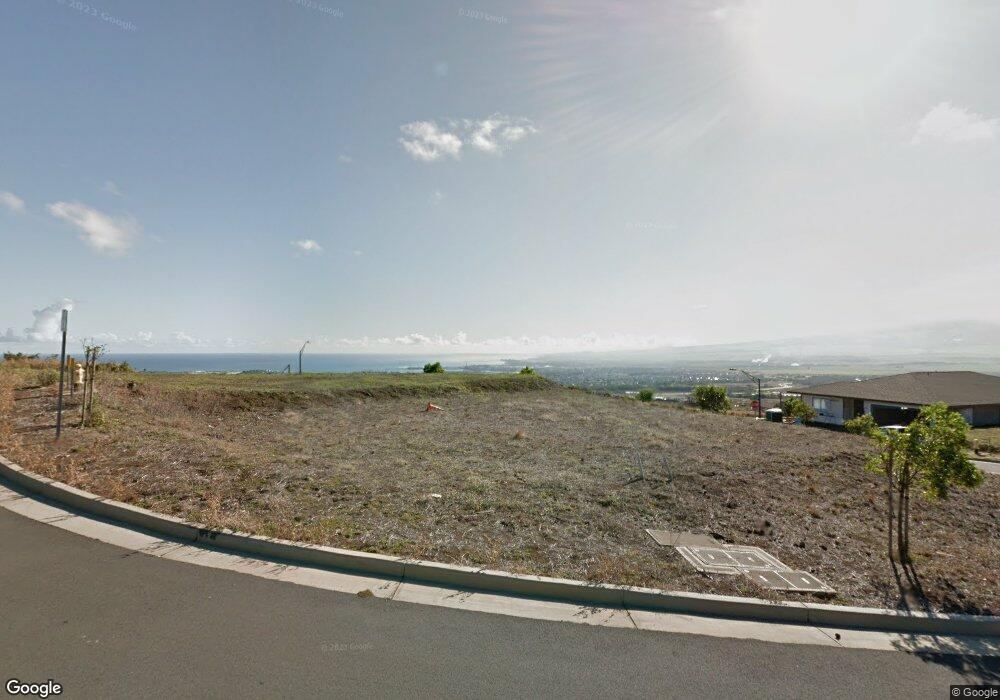
2 Pi'Ipi'i Way Unit Home Site 71 Wailuku, HI 96793
Estimated Value: $1,401,000 - $1,733,000
3
Beds
3
Baths
1,782
Sq Ft
$861/Sq Ft
Est. Value
About This Home
This home is located at 2 Pi'Ipi'i Way Unit Home Site 71, Wailuku, HI 96793 and is currently estimated at $1,535,051, approximately $861 per square foot. 2 Pi'Ipi'i Way Unit Home Site 71 is a home located in Maui County with nearby schools including Puu Kukui Elementary School, Iao Intermediate School, and Henry Perrine Baldwin High School.
Ownership History
Date
Name
Owned For
Owner Type
Purchase Details
Closed on
May 10, 2022
Sold by
Chai Derrick G H and Chai Michelle P
Bought by
Derrick G H Chai And Michelle P Reyes-Chai Li
Current Estimated Value
Home Financials for this Owner
Home Financials are based on the most recent Mortgage that was taken out on this home.
Original Mortgage
$350,000
Outstanding Balance
$330,701
Interest Rate
4.67%
Mortgage Type
Credit Line Revolving
Estimated Equity
$1,204,350
Purchase Details
Closed on
Oct 24, 2018
Sold by
Chai Derrick Gilbert Ha Aheo and Reyes Chai Michelle Pascual
Bought by
Chai Derrick G H and Reyes Chai Michelle P
Purchase Details
Closed on
Jul 13, 2009
Sold by
Koa At Kehalani Llc
Bought by
Chai Derrick Gilbert Haaheo and Reyes Chai Michelle Pascual
Create a Home Valuation Report for This Property
The Home Valuation Report is an in-depth analysis detailing your home's value as well as a comparison with similar homes in the area
Home Values in the Area
Average Home Value in this Area
Purchase History
| Date | Buyer | Sale Price | Title Company |
|---|---|---|---|
| Derrick G H Chai And Michelle P Reyes-Chai Li | -- | Title Guaranty | |
| Chai Derrick G H | -- | Title Guaranty | |
| Chai Derrick G H | -- | None Available | |
| Chai Derrick Gilbert Haaheo | $205,000 | Tg |
Source: Public Records
Mortgage History
| Date | Status | Borrower | Loan Amount |
|---|---|---|---|
| Open | Chai Derrick G H | $350,000 |
Source: Public Records
Tax History Compared to Growth
Tax History
| Year | Tax Paid | Tax Assessment Tax Assessment Total Assessment is a certain percentage of the fair market value that is determined by local assessors to be the total taxable value of land and additions on the property. | Land | Improvement |
|---|---|---|---|---|
| 2025 | $1,720 | $1,439,300 | $869,800 | $569,500 |
| 2024 | $1,720 | $1,255,600 | $713,400 | $542,200 |
| 2023 | $1,604 | $1,144,200 | $596,200 | $548,000 |
| 2022 | $1,336 | $868,000 | $371,400 | $496,600 |
| 2021 | $1,524 | $832,300 | $371,400 | $460,900 |
| 2020 | $1,618 | $844,700 | $430,000 | $414,700 |
| 2019 | $1,663 | $773,600 | $371,400 | $402,200 |
| 2018 | $1,586 | $756,600 | $283,400 | $473,200 |
| 2017 | $1,516 | $0 | $0 | $0 |
| 2016 | $3,728 | $703,400 | $312,700 | $390,700 |
| 2015 | -- | $244,300 | $244,300 | $0 |
Source: Public Records
Map
Nearby Homes
- 45 Papakapu Place
- 101 Kiha Place Unit Lot 41
- 101 Hopo'I Place Unit 51B
- 511 Kualau St
- 116 Hopoi Place Unit 57
- 124 Hopoi Place
- 41 Kokea St Unit 1003
- 66 Awela Cir Unit 2803
- 535 S Alu Rd
- 33 Kokea St Unit 901
- 571 S Alu Rd Unit I
- 563 Kauna Lipo Dr
- 629 Kauna Lipo Dr Unit 13
- 508 Kauna Lipo Dr Unit LOT 39
- 637 Kauna Lipo Dr Unit 14
- 673 Kauna Lipo Dr Unit 18
- 107 Kinohi Loa St
- 67 Kinohi Loa Loop
- Nahele (K9) Plan at Anuhea at Kehalani - Anuhea
- Hui'hui' (IK6) Plan at Anuhea at Kehalani - Anuhea
- 2 Piipii Way
- 9 Piipii Way
- 12 Piipii Way
- 3 Piipii Way
- 15 Piipii Way
- 15 Piipii Way Unit 69
- 68 Papakapu Place
- 59 Papakapu Place
- 59 Papakapu Place Unit 66
- 60 Papakapu Place
- 74 Papakapu Place
- 74 Papakapu Place Unit Home Site 50
- 53 Papakapu Place
- 53 Papakapu Place Unit 65
- 50 Papakapu Place
- 531 Kualau St
- 527 Kualau St
- 525 Kualau St
- 40 Papakapu Place
- 55 Paalae Place