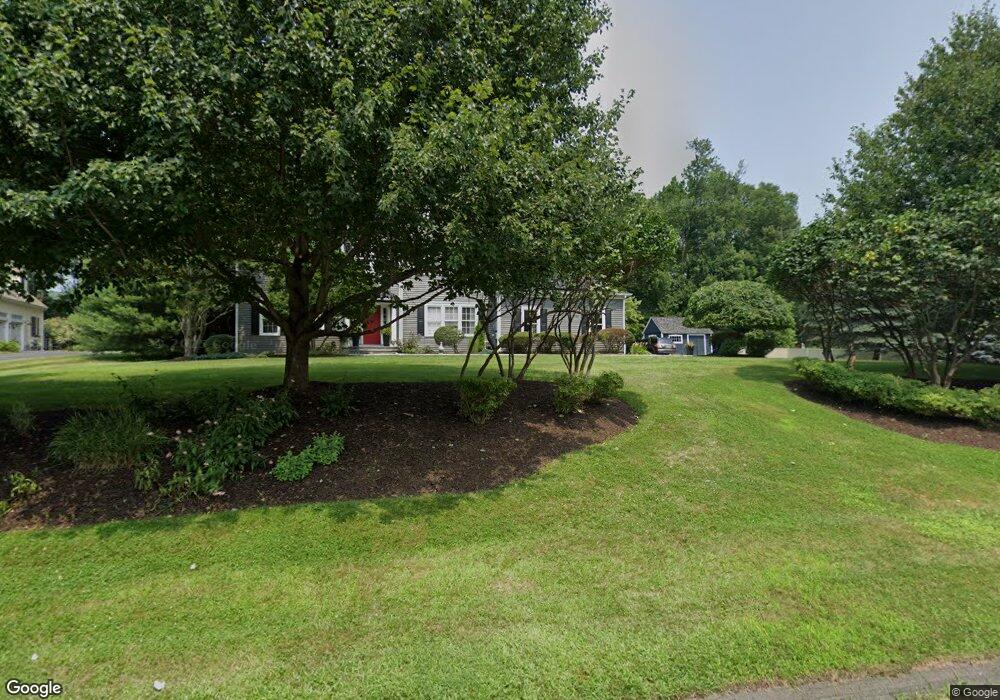
2 Pinnacle Dr Newtown, CT 06470
Estimated Value: $805,958 - $990,000
4
Beds
2
Baths
3,654
Sq Ft
$253/Sq Ft
Est. Value
About This Home
This home is located at 2 Pinnacle Dr, Newtown, CT 06470 and is currently estimated at $926,240, approximately $253 per square foot. 2 Pinnacle Dr is a home located in Fairfield County with nearby schools including Head O'Meadow Elementary School, Reed Intermediate School, and Newtown Middle School.
Ownership History
Date
Name
Owned For
Owner Type
Purchase Details
Closed on
Nov 12, 2010
Sold by
Mcandrew Christopher L and Mcandrew Christine E
Bought by
Howe Charles R
Current Estimated Value
Purchase Details
Closed on
Jul 3, 2008
Sold by
Caldwell Elizabeth Cb
Bought by
Wilson Michael and Wilson Lorraine
Home Financials for this Owner
Home Financials are based on the most recent Mortgage that was taken out on this home.
Original Mortgage
$536,000
Interest Rate
6.01%
Purchase Details
Closed on
Mar 12, 1999
Sold by
Newtown Dev Group Llc
Bought by
Caldwell Elizabeth Cb
Purchase Details
Closed on
Jul 12, 1996
Sold by
Cl&P Co
Bought by
Murtha Mary A and Setz Beverly
Purchase Details
Closed on
Nov 22, 1995
Sold by
Matschke Marilyn
Bought by
Murtha Mary A and Murtha Beverly
Purchase Details
Closed on
Jan 10, 1995
Sold by
Est Strano Arthur and Senor Rita Mary
Bought by
Matschke Marilyn
Create a Home Valuation Report for This Property
The Home Valuation Report is an in-depth analysis detailing your home's value as well as a comparison with similar homes in the area
Home Values in the Area
Average Home Value in this Area
Purchase History
| Date | Buyer | Sale Price | Title Company |
|---|---|---|---|
| Howe Charles R | $410,000 | -- | |
| Mcandrew Christopher L | $560,000 | -- | |
| Howe Charles R | $410,000 | -- | |
| Wilson Michael | $670,000 | -- | |
| Wilson Michael | $670,000 | -- | |
| Caldwell Elizabeth Cb | $410,000 | -- | |
| Caldwell Elizabeth Cb | $410,000 | -- | |
| Murtha Mary A | $270,000 | -- | |
| Murtha Mary A | $250,000 | -- | |
| Matschke Marilyn | $139,900 | -- |
Source: Public Records
Mortgage History
| Date | Status | Borrower | Loan Amount |
|---|---|---|---|
| Open | Matschke Marilyn | $410,000 | |
| Previous Owner | Matschke Marilyn | $536,000 |
Source: Public Records
Tax History
| Year | Tax Paid | Tax Assessment Tax Assessment Total Assessment is a certain percentage of the fair market value that is determined by local assessors to be the total taxable value of land and additions on the property. | Land | Improvement |
|---|---|---|---|---|
| 2025 | $12,276 | $427,130 | $101,720 | $325,410 |
| 2024 | $11,520 | $427,130 | $101,720 | $325,410 |
| 2023 | $11,208 | $427,130 | $101,720 | $325,410 |
| 2022 | $10,893 | $314,200 | $84,770 | $229,430 |
| 2021 | $10,887 | $314,200 | $84,770 | $229,430 |
| 2020 | $10,922 | $314,200 | $84,770 | $229,430 |
| 2019 | $10,925 | $314,200 | $84,770 | $229,430 |
| 2018 | $10,758 | $314,200 | $84,770 | $229,430 |
| 2017 | $10,999 | $324,730 | $93,070 | $231,660 |
| 2016 | $10,911 | $324,730 | $93,070 | $231,660 |
| 2015 | $10,739 | $324,730 | $93,070 | $231,660 |
| 2014 | $10,817 | $324,730 | $93,070 | $231,660 |
Source: Public Records
Map
Nearby Homes
- 16 Cemetery Rd
- 18 N Branch Rd
- 19 Brookwood Dr
- 52 Key Rock Rd
- 73 Dodgingtown Rd
- 15 Codfish Hill Road Extension
- 92 Head of Meadow Rd
- 14 Merlins Ln
- 36 Shelley Rd
- 109 Codfish Hill Rd
- 62 Codfish Hill Rd
- 6 Katrina Cir
- 9 Katrina Cir
- 18 Head of Meadow Rd
- 72 Old Hawleyville Rd
- 62 Linda Ln
- 55 Sugar St Unit 9
- 55 Sugar St Unit 31
- 55 Sugar St Unit 33
- 55 Sugar St Unit 3
Your Personal Tour Guide
Ask me questions while you tour the home.