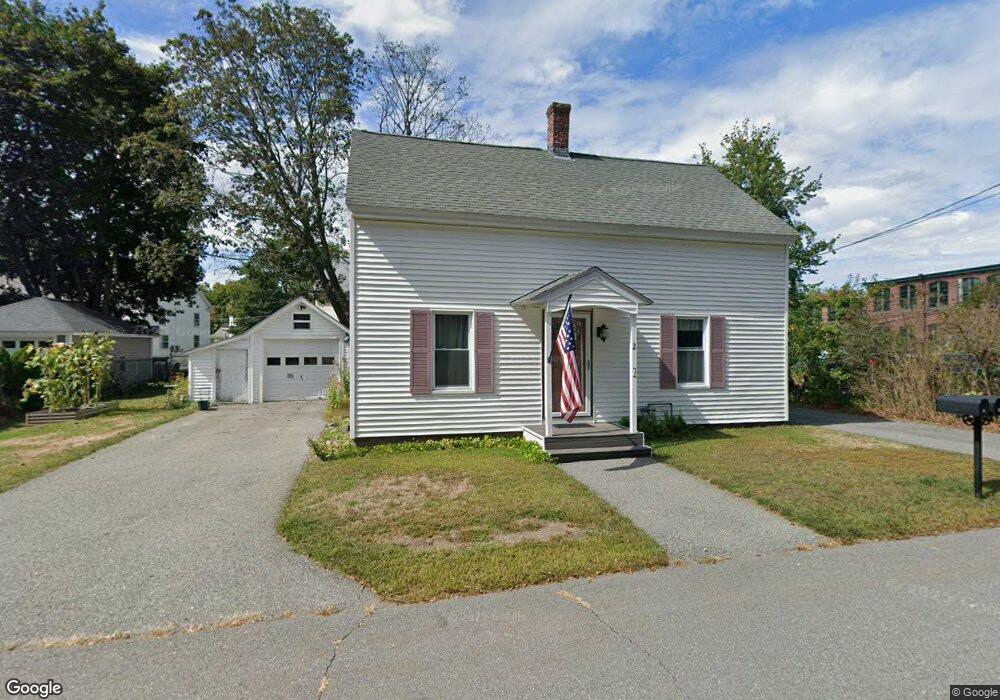
2 Pond St Westford, MA 01886
Estimated Value: $400,000 - $534,000
3
Beds
1
Bath
945
Sq Ft
$503/Sq Ft
Est. Value
About This Home
This home is located at 2 Pond St, Westford, MA 01886 and is currently estimated at $475,614, approximately $503 per square foot. 2 Pond St is a home located in Middlesex County with nearby schools including Col John Robinson, John A. Crisafulli Elementary School, and Blanchard Middle School.
Ownership History
Date
Name
Owned For
Owner Type
Purchase Details
Closed on
Nov 3, 2022
Sold by
Kirwin Alice M
Bought by
Alice M Kirwin Ret
Current Estimated Value
Purchase Details
Closed on
Feb 1, 1990
Sold by
Lamy Antoinette
Bought by
Kirwin Peter
Home Financials for this Owner
Home Financials are based on the most recent Mortgage that was taken out on this home.
Original Mortgage
$101,700
Interest Rate
9.59%
Mortgage Type
Purchase Money Mortgage
Create a Home Valuation Report for This Property
The Home Valuation Report is an in-depth analysis detailing your home's value as well as a comparison with similar homes in the area
Home Values in the Area
Average Home Value in this Area
Purchase History
| Date | Buyer | Sale Price | Title Company |
|---|---|---|---|
| Alice M Kirwin Ret | -- | None Available | |
| Kirwin Peter | $113,000 | -- |
Source: Public Records
Mortgage History
| Date | Status | Borrower | Loan Amount |
|---|---|---|---|
| Previous Owner | Kirwin Peter | $88,000 | |
| Previous Owner | Kirwin Peter | $101,700 |
Source: Public Records
Tax History Compared to Growth
Tax History
| Year | Tax Paid | Tax Assessment Tax Assessment Total Assessment is a certain percentage of the fair market value that is determined by local assessors to be the total taxable value of land and additions on the property. | Land | Improvement |
|---|---|---|---|---|
| 2025 | $5,450 | $404,600 | $277,000 | $127,600 |
| 2024 | $5,308 | $385,500 | $263,800 | $121,700 |
| 2023 | $5,300 | $359,100 | $251,300 | $107,800 |
| 2022 | $4,731 | $293,500 | $187,500 | $106,000 |
| 2021 | $4,523 | $271,800 | $187,500 | $84,300 |
| 2020 | $4,438 | $271,800 | $187,500 | $84,300 |
| 2019 | $4,110 | $248,200 | $179,700 | $68,500 |
| 2018 | $3,890 | $240,400 | $171,900 | $68,500 |
| 2017 | $3,741 | $228,000 | $171,900 | $56,100 |
| 2016 | $3,470 | $212,900 | $164,000 | $48,900 |
| 2015 | $3,646 | $224,500 | $164,000 | $60,500 |
| 2014 | $3,511 | $211,500 | $156,500 | $55,000 |
Source: Public Records
Map
Nearby Homes
- 9 Elm St
- 16 Abbot St
- 8 Sandy Beach Rd
- 12 Brookfield Dr Unit A
- 66 Patten Rd
- 222 Forge Village Rd
- Lot 6 Noble Path
- Lot 7 Noble Path
- 34 West St
- 66 N Main St Unit 66
- 64 N Main St Unit 64
- 3 Hillside Ave
- 26 Bayberry Rd
- 12 Patten Rd
- 19-21 Broadway St
- 6 Little Hollow Ln
- 11 River St
- 41 Flagg Rd
- 7 Mill Park Place
- 1 Thistle Ln