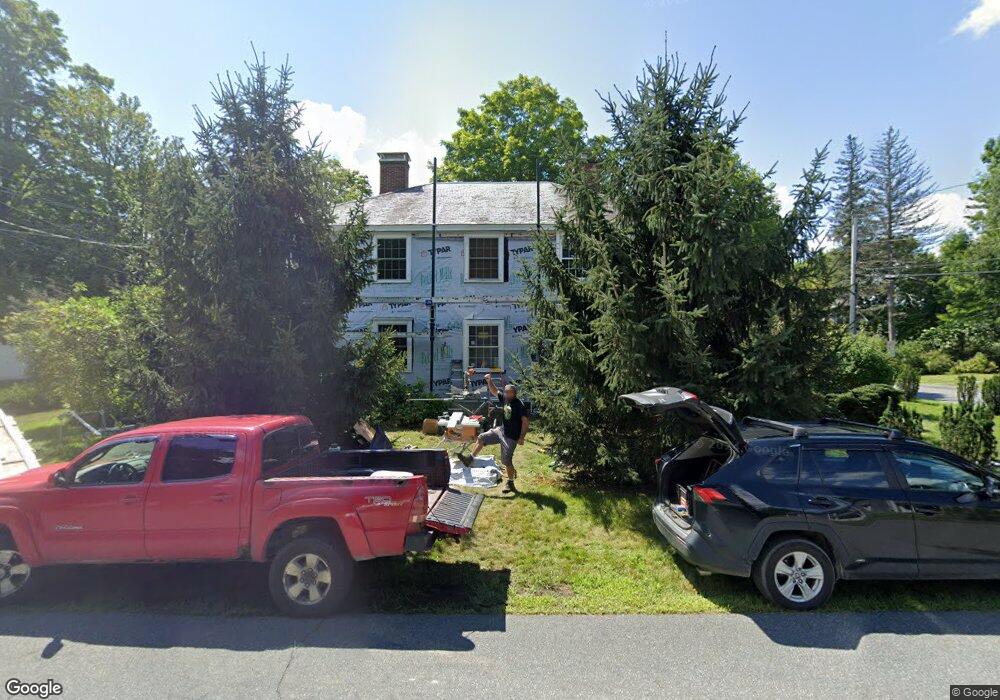
2 Prospect St Unit 2 Hanover, NH 03755
Estimated Value: $479,000 - $923,000
3
Beds
1
Bath
1,640
Sq Ft
$407/Sq Ft
Est. Value
About This Home
This home is located at 2 Prospect St Unit 2, Hanover, NH 03755 and is currently estimated at $667,916, approximately $407 per square foot. 2 Prospect St Unit 2 is a home located in Grafton County with nearby schools including Bernice A. Ray School, Frances C. Richmond School, and Hanover High School.
Ownership History
Date
Name
Owned For
Owner Type
Purchase Details
Closed on
Jul 7, 2022
Sold by
Putnam Elaine M
Bought by
Legacy Lane Llc
Current Estimated Value
Purchase Details
Closed on
Oct 27, 2009
Sold by
Sliwinski Ronald T
Bought by
Booker William L and Booker Christine
Home Financials for this Owner
Home Financials are based on the most recent Mortgage that was taken out on this home.
Original Mortgage
$260,000
Interest Rate
5.09%
Purchase Details
Closed on
Jun 30, 2008
Sold by
Dartmouth College
Bought by
Sliwinski Ronald T
Home Financials for this Owner
Home Financials are based on the most recent Mortgage that was taken out on this home.
Original Mortgage
$468,000
Interest Rate
6.07%
Mortgage Type
Purchase Money Mortgage
Create a Home Valuation Report for This Property
The Home Valuation Report is an in-depth analysis detailing your home's value as well as a comparison with similar homes in the area
Home Values in the Area
Average Home Value in this Area
Purchase History
| Date | Buyer | Sale Price | Title Company |
|---|---|---|---|
| Legacy Lane Llc | $360,000 | None Available | |
| Booker William L | $325,000 | -- | |
| Sliwinski Ronald T | $585,000 | -- |
Source: Public Records
Mortgage History
| Date | Status | Borrower | Loan Amount |
|---|---|---|---|
| Previous Owner | Sliwinski Ronald T | $276,000 | |
| Previous Owner | Sliwinski Ronald T | $253,000 | |
| Previous Owner | Sliwinski Ronald T | $260,000 | |
| Previous Owner | Sliwinski Ronald T | $468,000 |
Source: Public Records
Tax History
| Year | Tax Paid | Tax Assessment Tax Assessment Total Assessment is a certain percentage of the fair market value that is determined by local assessors to be the total taxable value of land and additions on the property. | Land | Improvement |
|---|---|---|---|---|
| 2025 | $10,624 | $763,800 | $0 | $763,800 |
| 2024 | $10,762 | $558,500 | $0 | $558,500 |
| 2023 | $10,143 | $547,100 | $0 | $547,100 |
| 2022 | $9,733 | $547,100 | $0 | $547,100 |
| 2021 | $9,637 | $546,300 | $0 | $546,300 |
| 2020 | $9,167 | $453,600 | $0 | $453,600 |
| 2019 | $9,040 | $453,600 | $0 | $453,600 |
| 2018 | $8,723 | $453,600 | $0 | $453,600 |
| 2017 | $6,511 | $300,200 | $92,100 | $208,100 |
| 2016 | $6,391 | $300,200 | $92,100 | $208,100 |
| 2015 | $6,268 | $300,200 | $92,100 | $208,100 |
| 2014 | $6,013 | $300,200 | $92,100 | $208,100 |
| 2013 | $5,797 | $300,200 | $92,100 | $208,100 |
| 2012 | $5,830 | $315,300 | $101,200 | $214,100 |
Source: Public Records
Map
Nearby Homes
- 23 School St
- 4 Occom Ridge
- 9 Wyeth Rd
- 1 O'Leary Ave
- 7 Birchbrook St
- 2 Hilton Field Ln
- 6 Wyeth Farm Cir
- 235 Main St Unit 2
- 25 Pinewood Village Rd Unit 25
- 85 Lebanon St
- 15 Melview Ridge
- 66 Oak Ridge Rd
- 187 Hopson Rd
- 4 Haskins Rd
- 15 Gile Dr Unit 3A
- 11 Gile Dr Unit 1B
- 27 College Hill Rd
- 4 Gile Dr Unit 2B
- 18 Linden Dr
- 15 College Hill
Your Personal Tour Guide
Ask me questions while you tour the home.