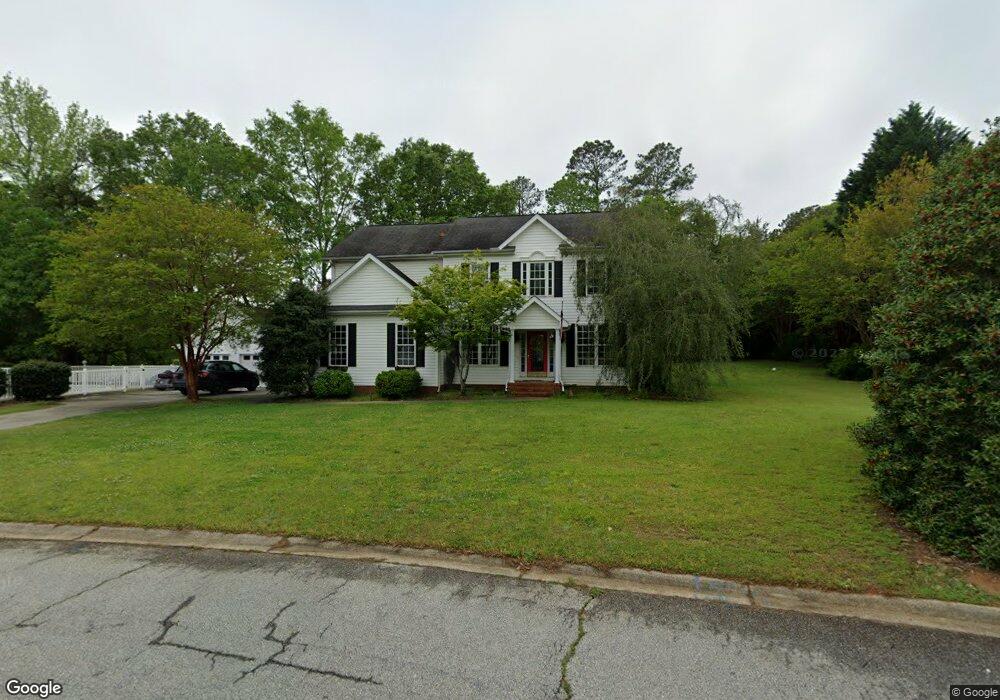
2 Rabon Chase Ct Fountain Inn, SC 29644
Estimated Value: $410,737 - $588,000
4
Beds
3
Baths
2,286
Sq Ft
$208/Sq Ft
Est. Value
About This Home
This home is located at 2 Rabon Chase Ct, Fountain Inn, SC 29644 and is currently estimated at $474,684, approximately $207 per square foot. 2 Rabon Chase Ct is a home located in Greenville County with nearby schools including Bryson Elementary School, Ralph Chandler Middle, and Woodmont High School.
Ownership History
Date
Name
Owned For
Owner Type
Purchase Details
Closed on
Nov 21, 2008
Sold by
Johnson Johnny William
Bought by
Johnson Anita Michelle
Current Estimated Value
Home Financials for this Owner
Home Financials are based on the most recent Mortgage that was taken out on this home.
Original Mortgage
$142,450
Outstanding Balance
$92,625
Interest Rate
5.89%
Mortgage Type
FHA
Estimated Equity
$382,059
Purchase Details
Closed on
Nov 14, 2008
Sold by
Johnson Anita Michelle
Bought by
Johnson Johnny William and Johnson Anita Michelle
Home Financials for this Owner
Home Financials are based on the most recent Mortgage that was taken out on this home.
Original Mortgage
$142,450
Outstanding Balance
$92,625
Interest Rate
5.89%
Mortgage Type
FHA
Estimated Equity
$382,059
Purchase Details
Closed on
May 9, 2000
Sold by
Rabon Chase Llc
Bought by
Johnson Johnny W
Create a Home Valuation Report for This Property
The Home Valuation Report is an in-depth analysis detailing your home's value as well as a comparison with similar homes in the area
Home Values in the Area
Average Home Value in this Area
Purchase History
| Date | Buyer | Sale Price | Title Company |
|---|---|---|---|
| Johnson Anita Michelle | -- | -- | |
| Johnson Anita Michelle | -- | -- | |
| Johnson Johnny William | -- | -- | |
| Johnson Johnny W | $20,425 | -- |
Source: Public Records
Mortgage History
| Date | Status | Borrower | Loan Amount |
|---|---|---|---|
| Open | Johnson Anita Michelle | $142,450 | |
| Closed | Johnson Anita Michelle | $142,450 |
Source: Public Records
Tax History Compared to Growth
Tax History
| Year | Tax Paid | Tax Assessment Tax Assessment Total Assessment is a certain percentage of the fair market value that is determined by local assessors to be the total taxable value of land and additions on the property. | Land | Improvement |
|---|---|---|---|---|
| 2024 | $1,691 | $10,830 | $1,360 | $9,470 |
| 2023 | $1,691 | $10,830 | $1,360 | $9,470 |
| 2022 | $1,647 | $10,830 | $1,360 | $9,470 |
| 2021 | $1,633 | $10,830 | $1,360 | $9,470 |
| 2020 | $1,617 | $10,310 | $1,350 | $8,960 |
| 2019 | $1,633 | $10,310 | $1,350 | $8,960 |
| 2018 | $1,632 | $10,310 | $1,350 | $8,960 |
| 2017 | $1,634 | $10,310 | $1,350 | $8,960 |
| 2016 | $1,574 | $257,860 | $33,770 | $224,090 |
| 2015 | $1,564 | $257,860 | $33,770 | $224,090 |
| 2014 | $1,331 | $224,244 | $28,124 | $196,120 |
Source: Public Records
Map
Nearby Homes
- 8 Windover Ln
- 4 Rosefield Ct
- 117 Robin Dr
- 313 Shagbark Cir
- 307 Forked Oak Way
- 00 Nash Mill Rd
- 11 Sanibel Oaks Dr
- 907 Sugar Oak Ct
- 303 Jenkins Bridge Rd
- 288 S Carolina 418
- 9 Emporia Ct
- 343 Fairview Church Rd
- 604 Holtview Place
- 124 Hartwick Ln
- 220 Jenkins Bridge Rd
- 120 Thomason View Rd
- 220 Roocroft Ct
- 228 Roocroft Ct
- 226 Roocroft Ct
- 221 Roocroft Ct
- 00 Robin Dr
- 4 Rabon Chase Ct
- 1 Rabon Chase Ct
- 236 Cash Dr
- 237 Cash Dr
- 25 Rabon Chase Ct
- 3 Rabon Chase Ct
- 100 Rabon Chase Ct
- 233 Cash Dr
- 1 Stone Chase Ct
- 368 Tall Pines Rd
- 3 Stone Chase Ct
- 420 Tall Pines Rd
- 104 Rabon Chase Ct
- 231 Cash Dr
- 2 Stone Chase Ct
- 407 Tall Pines Rd
- 6 Stone Chase Ct
- 105 Rabon Chase Ct
- 106 Rabon Chase Ct