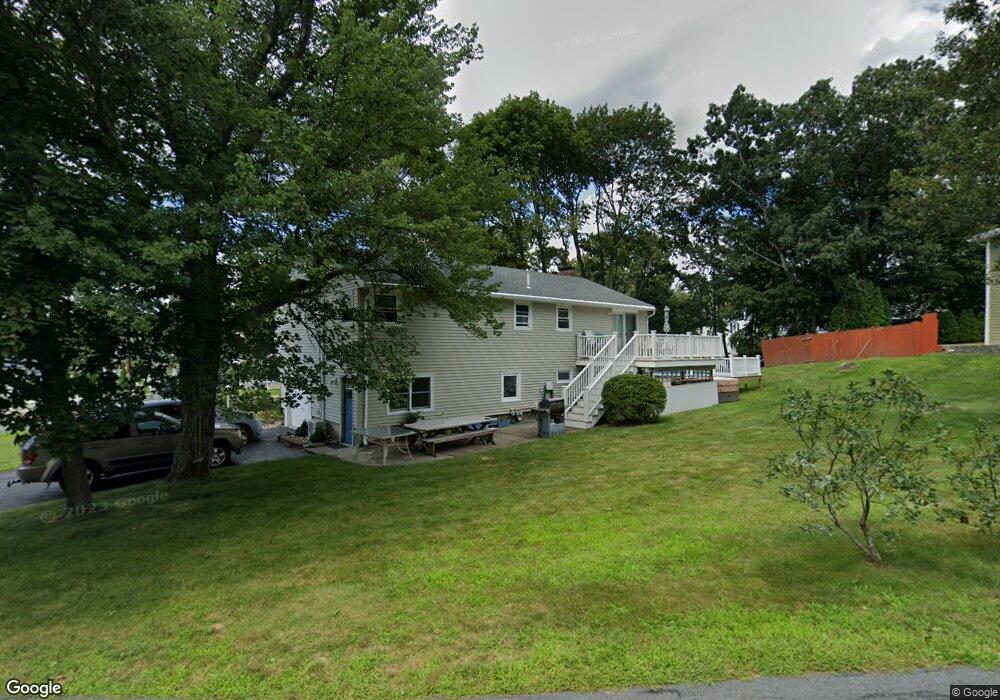
2 Rag Rock Dr Woburn, MA 01801
Cummingsville NeighborhoodEstimated Value: $600,000 - $859,000
4
Beds
2
Baths
1,184
Sq Ft
$623/Sq Ft
Est. Value
About This Home
This home is located at 2 Rag Rock Dr, Woburn, MA 01801 and is currently estimated at $737,437, approximately $622 per square foot. 2 Rag Rock Dr is a home located in Middlesex County with nearby schools including Hurld Elementary School, Daniel L. Joyce Middle School, and Woburn High School.
Ownership History
Date
Name
Owned For
Owner Type
Purchase Details
Closed on
Sep 15, 2017
Sold by
Peront Rene L and Peront Ruth E
Bought by
Bell Bryan M and Bell Emily R
Current Estimated Value
Home Financials for this Owner
Home Financials are based on the most recent Mortgage that was taken out on this home.
Original Mortgage
$350,000
Outstanding Balance
$292,510
Interest Rate
3.93%
Mortgage Type
New Conventional
Estimated Equity
$444,927
Purchase Details
Closed on
May 8, 2014
Sold by
Peront Ruth E
Bought by
Peront Rene L and Peront Ruth E
Purchase Details
Closed on
Jul 16, 1981
Bought by
Peront Rene L
Create a Home Valuation Report for This Property
The Home Valuation Report is an in-depth analysis detailing your home's value as well as a comparison with similar homes in the area
Home Values in the Area
Average Home Value in this Area
Purchase History
| Date | Buyer | Sale Price | Title Company |
|---|---|---|---|
| Bell Bryan M | $350,000 | -- | |
| Peront Rene L | -- | -- | |
| Peront Rene L | -- | -- | |
| Peront Rene L | -- | -- |
Source: Public Records
Mortgage History
| Date | Status | Borrower | Loan Amount |
|---|---|---|---|
| Open | Bell Bryan M | $350,000 | |
| Closed | Peront Rene L | $350,000 |
Source: Public Records
Tax History
| Year | Tax Paid | Tax Assessment Tax Assessment Total Assessment is a certain percentage of the fair market value that is determined by local assessors to be the total taxable value of land and additions on the property. | Land | Improvement |
|---|---|---|---|---|
| 2025 | $5,761 | $674,600 | $334,600 | $340,000 |
| 2024 | $5,308 | $658,600 | $318,600 | $340,000 |
| 2023 | $5,143 | $591,100 | $289,700 | $301,400 |
| 2022 | $5,015 | $536,900 | $251,900 | $285,000 |
| 2021 | $4,794 | $513,800 | $239,900 | $273,900 |
| 2020 | $4,626 | $496,400 | $239,900 | $256,500 |
| 2019 | $4,373 | $460,300 | $228,500 | $231,800 |
| 2018 | $4,175 | $422,100 | $209,600 | $212,500 |
| 2017 | $4,025 | $404,900 | $199,700 | $205,200 |
| 2016 | $3,841 | $382,200 | $186,600 | $195,600 |
| 2015 | $3,698 | $363,600 | $174,400 | $189,200 |
| 2014 | $3,545 | $339,600 | $174,400 | $165,200 |
Source: Public Records
Map
Nearby Homes
- 12 Cassidy Dr
- 17 Wright St
- 80 N Warren St Unit 31
- 6 Randall Dr
- 148 Wyman St Unit 148
- 136 Bedford Rd
- 166 Place Ln Unit 166
- 168 Place Ln
- 380 Place Ln
- 52 Pleasant St
- 555 Main St Unit 11
- 24 Lowell St
- 31 Arlington Rd Unit 1-6
- 14 Church Ave
- 45 Lowell St
- 27 Arlington Rd Unit 2
- 41 Lowell St
- 477 Main St
- 82 Lowell St
- 7 Prospect St
Your Personal Tour Guide
Ask me questions while you tour the home.