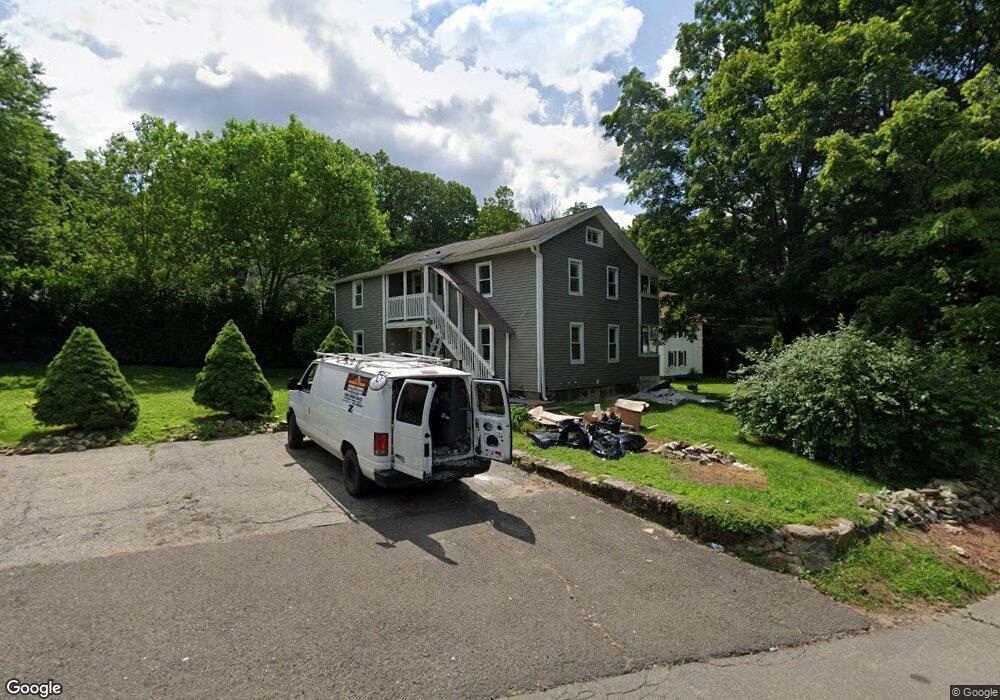
2 Rimmondale St Seymour, CT 06483
Estimated Value: $300,000 - $375,000
4
Beds
2
Baths
1,880
Sq Ft
$182/Sq Ft
Est. Value
About This Home
This home is located at 2 Rimmondale St, Seymour, CT 06483 and is currently estimated at $341,889, approximately $181 per square foot. 2 Rimmondale St is a home located in New Haven County with nearby schools including Seymour Middle School, Seymour High School, and Assumption School.
Ownership History
Date
Name
Owned For
Owner Type
Purchase Details
Closed on
Mar 27, 2024
Sold by
Carey Ryan
Bought by
Trepca Ardhe
Current Estimated Value
Home Financials for this Owner
Home Financials are based on the most recent Mortgage that was taken out on this home.
Original Mortgage
$244,625
Outstanding Balance
$241,011
Interest Rate
6.94%
Mortgage Type
Stand Alone Refi Refinance Of Original Loan
Estimated Equity
$100,878
Purchase Details
Closed on
May 31, 2006
Sold by
Docherty Fiona
Bought by
Carey Ryan
Home Financials for this Owner
Home Financials are based on the most recent Mortgage that was taken out on this home.
Original Mortgage
$215,650
Interest Rate
6.55%
Purchase Details
Closed on
Jun 2, 1999
Sold by
Big County Rlty Llc
Bought by
Docherty Agnes and Docherty Fiona
Purchase Details
Closed on
Jan 15, 1992
Sold by
Anderson Tr William
Bought by
Kucharzyk Eric and Kucharzyk Laura
Purchase Details
Closed on
Nov 21, 1990
Sold by
Sangster Herta
Bought by
Collier Evelyn
Create a Home Valuation Report for This Property
The Home Valuation Report is an in-depth analysis detailing your home's value as well as a comparison with similar homes in the area
Home Values in the Area
Average Home Value in this Area
Purchase History
| Date | Buyer | Sale Price | Title Company |
|---|---|---|---|
| Trepca Ardhe | $257,500 | None Available | |
| Trepca Ardhe | $257,500 | None Available | |
| Carey Ryan | $238,900 | -- | |
| Carey Ryan | $238,900 | -- | |
| Docherty Agnes | $119,500 | -- | |
| Docherty Agnes | $119,500 | -- | |
| Kucharzyk Eric | $105,000 | -- | |
| Collier Evelyn | $148,000 | -- |
Source: Public Records
Mortgage History
| Date | Status | Borrower | Loan Amount |
|---|---|---|---|
| Open | Trepca Ardhe | $244,625 | |
| Closed | Trepca Ardhe | $244,625 | |
| Previous Owner | Collier Evelyn | $193,913 | |
| Previous Owner | Collier Evelyn | $215,650 |
Source: Public Records
Tax History Compared to Growth
Tax History
| Year | Tax Paid | Tax Assessment Tax Assessment Total Assessment is a certain percentage of the fair market value that is determined by local assessors to be the total taxable value of land and additions on the property. | Land | Improvement |
|---|---|---|---|---|
| 2025 | $4,593 | $165,690 | $41,510 | $124,180 |
| 2024 | $5,057 | $137,270 | $32,620 | $104,650 |
| 2023 | $4,939 | $137,270 | $32,620 | $104,650 |
| 2022 | $4,885 | $137,270 | $32,620 | $104,650 |
| 2021 | $4,765 | $137,270 | $32,620 | $104,650 |
| 2020 | $4,218 | $117,180 | $38,290 | $78,890 |
| 2019 | $4,218 | $117,180 | $38,290 | $78,890 |
| 2018 | $4,218 | $117,180 | $38,290 | $78,890 |
| 2017 | $4,218 | $117,180 | $38,290 | $78,890 |
| 2016 | $4,218 | $117,180 | $38,290 | $78,890 |
| 2015 | $4,356 | $125,930 | $40,320 | $85,610 |
| 2014 | $4,287 | $125,930 | $40,320 | $85,610 |
Source: Public Records
Map
Nearby Homes
- 17 Meadow St Unit 23
- 32 Roberts St
- 10 Highland Ave
- 31 Skokorat St
- 61 Pershing Ave
- 38 Sanford St
- 10 Kulas Terrace
- 6/6A Chatfield St
- 28 Charles Rd
- 26-28 S Main St
- 226 Walnut St
- 5 Forest Hollow Rd
- 77 Laurie Ln
- 77 S Main St
- 11 Oxford Rd
- 78 Hillside Dr
- 35 Cogwheel Ln
- 202 W Church St
- 9 Wooster St
- 37 Quarry Rd
- 3 Rimmondale St
- 5 Rimmondale St
- 1 Rimmondale St
- 28 Rimmondale St
- 4 Rimmondale St
- 6 Rimmondale St
- 6 Rimmondale St Unit 2
- 10 Rimmondale St
- 8 Rimmondale St
- 8 Rimmondale St Unit 2ND F
- 8 Rimmondale St Unit flr 1
- 8 Rimmondale St Unit flr 2
- 8 Rimmondale St Unit 3
- 8 Rimmondale St Unit 2
- 8 Rimmondale St Unit 1
- 470 N Main St
- 462 N Main St
- 14 Rimmondale St
- 481 N Main St
- 16 Rimmondale St