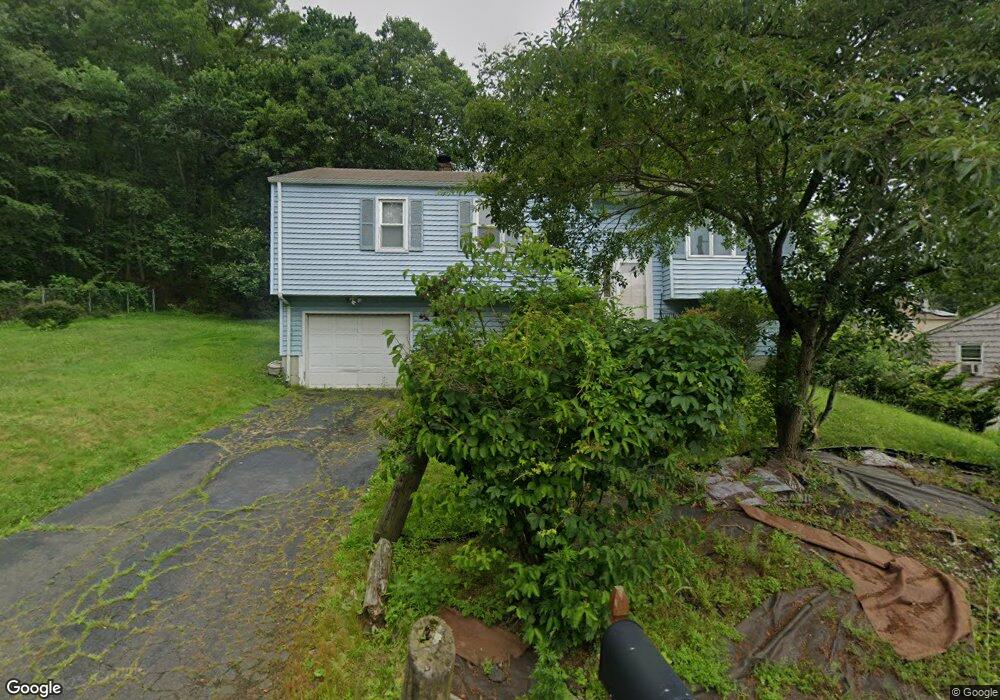
2 Robart St West Haven, CT 06516
Allingtown NeighborhoodEstimated Value: $349,000 - $384,000
3
Beds
3
Baths
1,044
Sq Ft
$354/Sq Ft
Est. Value
About This Home
This home is located at 2 Robart St, West Haven, CT 06516 and is currently estimated at $369,326, approximately $353 per square foot. 2 Robart St is a home located in New Haven County with nearby schools including Carrigan 5/6 Intermediate School, Harry M. Bailey Middle School, and West Haven High School.
Ownership History
Date
Name
Owned For
Owner Type
Purchase Details
Closed on
Sep 7, 2011
Sold by
Jean-Louis David and Jean-Louis Nathalie
Bought by
Goff Bailey and Gearlds Roy
Current Estimated Value
Home Financials for this Owner
Home Financials are based on the most recent Mortgage that was taken out on this home.
Original Mortgage
$14,900
Outstanding Balance
$10,358
Interest Rate
4.58%
Mortgage Type
Purchase Money Mortgage
Estimated Equity
$358,968
Purchase Details
Closed on
Apr 29, 2005
Sold by
Thornton Kristen M and Smith Darren D
Bought by
Jean-Louis David and Jean-Louis Nathalie
Purchase Details
Closed on
Apr 28, 2003
Sold by
Botelho James and Smith Lois
Bought by
Smith Darren D and Thornton Kristen M
Purchase Details
Closed on
Oct 7, 1991
Sold by
Holt Robert A
Bought by
Botelho James and Smith Lois
Create a Home Valuation Report for This Property
The Home Valuation Report is an in-depth analysis detailing your home's value as well as a comparison with similar homes in the area
Home Values in the Area
Average Home Value in this Area
Purchase History
| Date | Buyer | Sale Price | Title Company |
|---|---|---|---|
| Goff Bailey | $169,000 | -- | |
| Jean-Louis David | $259,900 | -- | |
| Smith Darren D | $182,500 | -- | |
| Goff Bailey | $169,000 | -- | |
| Jean-Louis David | $259,900 | -- | |
| Smith Darren D | $182,500 | -- | |
| Botelho James | $125,000 | -- |
Source: Public Records
Mortgage History
| Date | Status | Borrower | Loan Amount |
|---|---|---|---|
| Open | Botelho James | $14,900 | |
| Closed | Botelho James | $14,900 | |
| Previous Owner | Botelho James | $287,797 |
Source: Public Records
Tax History Compared to Growth
Tax History
| Year | Tax Paid | Tax Assessment Tax Assessment Total Assessment is a certain percentage of the fair market value that is determined by local assessors to be the total taxable value of land and additions on the property. | Land | Improvement |
|---|---|---|---|---|
| 2025 | $7,378 | $216,930 | $60,620 | $156,310 |
| 2024 | $6,681 | $139,510 | $42,000 | $97,510 |
| 2023 | $6,476 | $139,510 | $42,000 | $97,510 |
| 2022 | $6,363 | $139,510 | $42,000 | $97,510 |
| 2021 | $6,364 | $139,510 | $42,000 | $97,510 |
| 2020 | $5,631 | $122,640 | $33,880 | $88,760 |
| 2019 | $5,631 | $122,640 | $33,880 | $88,760 |
| 2018 | $6,049 | $122,640 | $33,880 | $88,760 |
| 2017 | $5,860 | $122,640 | $33,880 | $88,760 |
| 2016 | $5,682 | $122,640 | $33,880 | $88,760 |
| 2015 | $6,016 | $147,840 | $37,450 | $110,390 |
| 2014 | $5,896 | $147,840 | $37,450 | $110,390 |
Source: Public Records
Map
Nearby Homes
- 0 Burwell & Woodfield Rd Unit 24051262
- 0 Burwell Rd
- 100 Yates St
- 29 Birch St
- 60 Andrews St
- 38 Chauncey St
- 50 Morris Ave
- 78 Nonquit St
- 36 Forest Hills Rd
- 52 Highview Ave
- 65 Westfield St
- 22 Bristol St
- 81 Homeside Ave
- 11 Priscilla Rd
- 103 Gilbert St
- 14 Homestead Ave
- 194 Homeside Ave
- 35 Terrace Ave
- 104 Terrace Ave
- 690 Forest Rd Unit 702