Estimated Value: $220,000 - $241,047
2
Beds
2
Baths
1,356
Sq Ft
$170/Sq Ft
Est. Value
About This Home
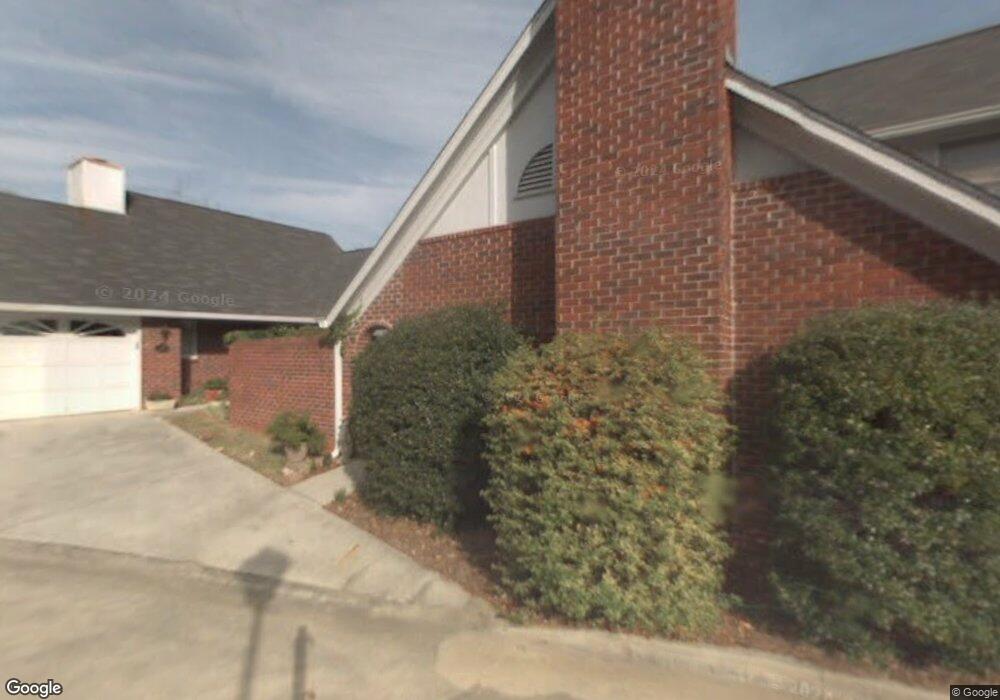
This home is located at 2 Robin St NW Unit 10, Rome, GA 30165 and is currently estimated at $230,012, approximately $169 per square foot. 2 Robin St NW Unit 10 is a home located in Floyd County with nearby schools including Rome High School and St. Mary School.
Ownership History
Date
Name
Owned For
Owner Type
Purchase Details
Closed on
Dec 1, 2023
Sold by
Edgar Spencer G
Bought by
Cucchiara Jason
Current Estimated Value
Purchase Details
Closed on
May 3, 2019
Sold by
Miller Donna
Bought by
Edgar Spencer G and Edgar Alice Ruth
Purchase Details
Closed on
Jun 23, 2016
Sold by
Vaughan Susan Hall
Bought by
Miller Donna and White Sandra Miller
Purchase Details
Closed on
May 30, 2006
Sold by
Not Provided
Bought by
Vaughan Susan Hall and Vaughan Lee Hall Petusky
Purchase Details
Closed on
Jan 6, 2005
Sold by
Hall Myra C
Bought by
Vaughan David N
Purchase Details
Closed on
May 8, 2003
Bought by
P and R
Purchase Details
Closed on
Aug 29, 2002
Sold by
Jacobs Jane W
Bought by
Smart Pamela
Purchase Details
Closed on
May 29, 1998
Sold by
Simmons Paul B and Simmons Katherine F
Bought by
Jacobs Jane W
Purchase Details
Closed on
Apr 24, 1995
Bought by
P and R
Purchase Details
Closed on
Apr 21, 1995
Bought by
P and R
Purchase Details
Closed on
Nov 6, 1990
Bought by
Latham Mildred B
Create a Home Valuation Report for This Property
The Home Valuation Report is an in-depth analysis detailing your home's value as well as a comparison with similar homes in the area
Home Values in the Area
Average Home Value in this Area
Purchase History
| Date | Buyer | Sale Price | Title Company |
|---|---|---|---|
| Cucchiara Jason | $215,000 | -- | |
| Edgar Spencer G | $139,000 | -- | |
| Miller Donna | $135,000 | -- | |
| Vaughan Susan Hall | $118,900 | -- | |
| Vaughan David N | $118,829 | -- | |
| P | -- | -- | |
| Hall Myra C | $115,000 | -- | |
| Hall Myra C | -- | -- | |
| Smart Pamela | $119,500 | -- | |
| Jacobs Jane W | $110,000 | -- | |
| P | -- | -- | |
| Simmons Paul B | $97,500 | -- | |
| P | -- | -- | |
| Latham Mildred B | $90,000 | -- |
Source: Public Records
Tax History Compared to Growth
Tax History
| Year | Tax Paid | Tax Assessment Tax Assessment Total Assessment is a certain percentage of the fair market value that is determined by local assessors to be the total taxable value of land and additions on the property. | Land | Improvement |
|---|---|---|---|---|
| 2024 | $3,033 | $79,581 | $0 | $79,581 |
| 2023 | $1,665 | $77,447 | $0 | $77,447 |
| 2022 | $1,522 | $65,160 | $0 | $65,160 |
| 2021 | $1,447 | $61,585 | $2,294 | $59,291 |
| 2020 | $1,333 | $58,972 | $2,294 | $56,678 |
| 2019 | $1,795 | $52,783 | $2,294 | $50,489 |
| 2018 | $1,749 | $50,125 | $2,294 | $47,831 |
| 2017 | $1,697 | $47,105 | $2,294 | $44,811 |
| 2016 | $1,533 | $41,280 | $2,280 | $39,000 |
| 2015 | $1,454 | $41,460 | $2,280 | $39,180 |
| 2014 | $1,454 | $41,460 | $2,280 | $39,180 |
Source: Public Records
Map
Nearby Homes
- 4 Colonial Dr NW
- 7 Raymond Ave NW
- 204 Oakwood St NW
- 208 Dodd St NW
- 0 Unbridled Rd Unit 22 23074684
- 14 Vineland Dr NW
- 614 Briarwood Cir NW
- 527 W 11th St NE
- 1005 N 2nd Ave NW Unit 39
- PEARSON Plan at Shorter Village
- 808 Charlton St NW
- 601 W 10th St NE
- 1006 Avenue A NE
- 9 Shorter Cir SW
- 715 Avenue A NE
- 209 Sherwood Rd SW
- 6 Horseleg Creek Rd SW
- 17 Rosewood Rd SW
- 0 Cypress St NE Unit 7494593
- 0 Cypress St NE Unit 10422946
- 2 Robin St NW Unit 5
- 2 Robin St NW Unit 4
- 2 Robin St NW Unit 3
- 2 Robin St NW Unit 5
- 2 Robin St NW Unit 9
- 2 Robin St NW Unit 8
- 2 Robin St NW Unit 7
- 2 Robin St NW Unit 6
- 2 Robin St NW Unit 2
- 2 Robin St NW Unit 1
- 2 Robin St NW Unit 1
- 2 Robin St NW
- 4 Robin St NW
- 1711 Martha Berry Blvd NW
- 6 Robin St NW
- 1709 Martha Berry Blvd NW
- 1709 Martha Berry Blvd NW
- 5 Robin St NW
- 1805 Martha Berry Blvd NW
- 3212 Martha Berry Blvd NE