2 Rose Thorn Ct Travelers Rest, SC 29690
Estimated Value: $662,025 - $913,000
4
Beds
4
Baths
2,685
Sq Ft
$297/Sq Ft
Est. Value
About This Home
This home is located at 2 Rose Thorn Ct, Travelers Rest, SC 29690 and is currently estimated at $797,506, approximately $297 per square foot. 2 Rose Thorn Ct is a home located in Greenville County with nearby schools including Slater Marietta Elementary School, Northwest Middle School, and Travelers Rest High School.
Ownership History
Date
Name
Owned For
Owner Type
Purchase Details
Closed on
Mar 9, 2015
Sold by
Laub Patricia R and Laub Raymond H
Bought by
Laub Patricia R and Laub Raymond H
Current Estimated Value
Purchase Details
Closed on
Oct 14, 2010
Sold by
Laub Patricia R
Bought by
Laub Raymond H
Purchase Details
Closed on
Jun 20, 2003
Sold by
Laub Raymond H
Bought by
Laub Patricia R
Purchase Details
Closed on
Oct 18, 2000
Sold by
Iffs At Glassy Inc The
Bought by
Ub Patricia R
Create a Home Valuation Report for This Property
The Home Valuation Report is an in-depth analysis detailing your home's value as well as a comparison with similar homes in the area
Home Values in the Area
Average Home Value in this Area
Purchase History
| Date | Buyer | Sale Price | Title Company |
|---|---|---|---|
| Laub Patricia R | -- | -- | |
| Laub Raymond H | -- | -- | |
| Laub Patricia R | -- | -- | |
| Ub Patricia R | $74,400 | -- |
Source: Public Records
Tax History Compared to Growth
Tax History
| Year | Tax Paid | Tax Assessment Tax Assessment Total Assessment is a certain percentage of the fair market value that is determined by local assessors to be the total taxable value of land and additions on the property. | Land | Improvement |
|---|---|---|---|---|
| 2024 | $1,786 | $13,910 | $2,300 | $11,610 |
| 2023 | $1,786 | $13,910 | $2,300 | $11,610 |
| 2022 | $1,743 | $13,910 | $2,300 | $11,610 |
| 2021 | $1,697 | $13,910 | $2,300 | $11,610 |
| 2020 | $1,702 | $13,300 | $2,300 | $11,000 |
| 2019 | $1,705 | $13,300 | $2,300 | $11,000 |
| 2018 | $1,701 | $13,300 | $2,300 | $11,000 |
| 2017 | $1,703 | $13,300 | $2,300 | $11,000 |
| 2016 | $1,642 | $332,410 | $57,400 | $275,010 |
| 2015 | $1,647 | $332,410 | $57,400 | $275,010 |
| 2014 | $1,526 | $324,150 | $80,360 | $243,790 |
Source: Public Records
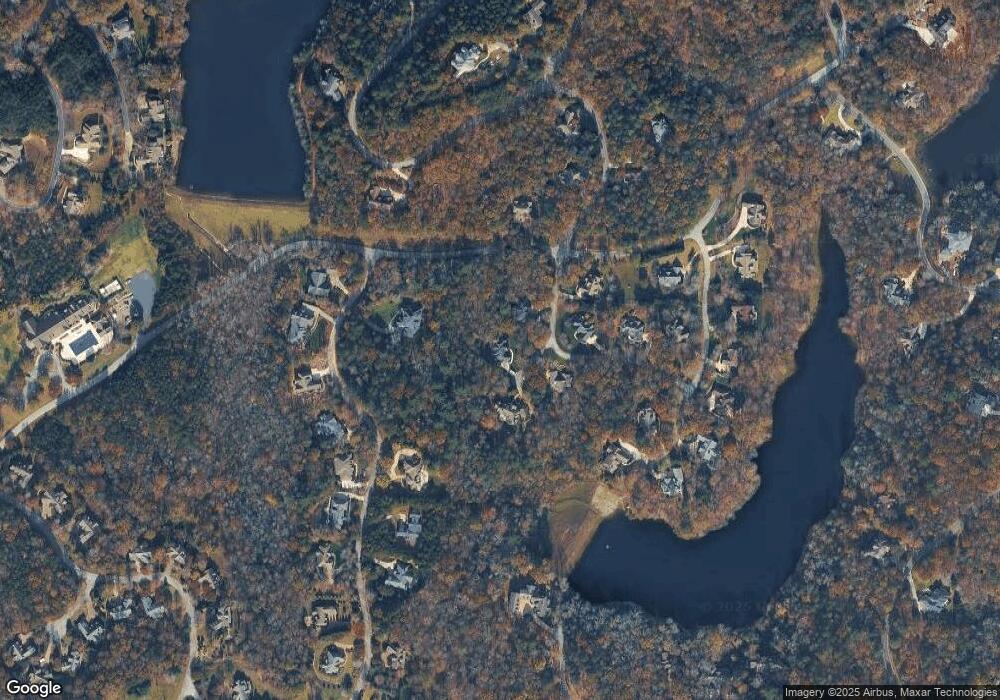
Map
Nearby Homes
- 95 Painter Creek Rd
- 6 Ridge Haven Trail
- 909 High Knoll Way
- 217 Ridge Haven Trail
- 25 Lake Hills Ln
- 221 Ridge Haven Trail
- 101 Terry Creek Rd
- 913 High Knoll Way
- 116 Stillcountry Cir
- 512 Terry Creek Rd
- 6 Brown Deer Trail
- 2 Autumn Oak Way
- 912 Hidden Hollow Trail
- 115 Mountain Summit Rd
- 105 Valley Lake Trail
- 120 Ridgerunner Way
- 18 Angle Stone Way
- 305 Sedgewick Rd
- 180 Painter Creek Rd
- 19 Foggy Ridge Way
- 2 Winding Oaks Dr
- 4 Rose Thorn Ct
- 1 Rose Thorn Ct
- 1 Laurel Cove Ln
- 101 Winding Oaks Dr
- 9 Laurel Cove Ln
- 15 Laurel Cove Ln Unit CV-LC-008
- 15 Laurel Cove Ln
- 1 Winding Oaks Dr
- 99 Painter Creek Rd
- 105 Winding Oaks Dr
- 19 Laurel Cove Ln
- 21 Laurel Cove Ln Unit Cliffs Valley Sectio
- 21 Laurel Cove Ln
- 102 R-Pd-191
- 102 Long Shadow Ln
- 95 Painter Creek Rd Unit CV-G-012
- 100 Long Shadow Ln
- 14 Laurel Cove Ln Unit CV-LC-007
- 416 Glen Hollow Rd