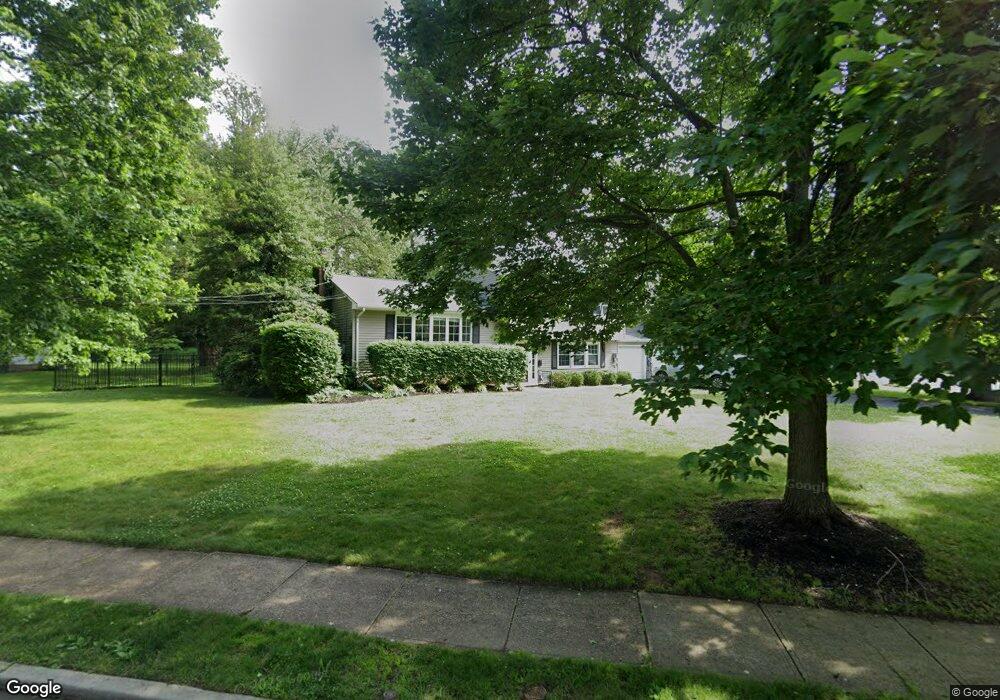
2 Ryan Rd Cranbury, NJ 08512
Estimated Value: $763,000 - $890,000
4
Beds
3
Baths
1,898
Sq Ft
$424/Sq Ft
Est. Value
About This Home
This home is located at 2 Ryan Rd, Cranbury, NJ 08512 and is currently estimated at $805,109, approximately $424 per square foot. 2 Ryan Rd is a home located in Middlesex County with nearby schools including The Cranbury School, E Windsor Knowledge Beginnings, and SciCore Academy.
Ownership History
Date
Name
Owned For
Owner Type
Purchase Details
Closed on
Feb 28, 2017
Sold by
Hoffman John B and Hoffman Laura M
Bought by
Berkery John W and Berkery Diana Jensen
Current Estimated Value
Home Financials for this Owner
Home Financials are based on the most recent Mortgage that was taken out on this home.
Original Mortgage
$489,600
Outstanding Balance
$406,228
Interest Rate
4.19%
Mortgage Type
New Conventional
Estimated Equity
$398,881
Create a Home Valuation Report for This Property
The Home Valuation Report is an in-depth analysis detailing your home's value as well as a comparison with similar homes in the area
Home Values in the Area
Average Home Value in this Area
Purchase History
| Date | Buyer | Sale Price | Title Company |
|---|---|---|---|
| Berkery John W | $544,000 | Weichert Title |
Source: Public Records
Mortgage History
| Date | Status | Borrower | Loan Amount |
|---|---|---|---|
| Open | Berkery John W | $489,600 |
Source: Public Records
Tax History
| Year | Tax Paid | Tax Assessment Tax Assessment Total Assessment is a certain percentage of the fair market value that is determined by local assessors to be the total taxable value of land and additions on the property. | Land | Improvement |
|---|---|---|---|---|
| 2025 | $8,636 | $470,900 | $239,800 | $231,100 |
| 2024 | $8,480 | $470,900 | $239,800 | $231,100 |
Source: Public Records
Map
Nearby Homes
Your Personal Tour Guide
Ask me questions while you tour the home.