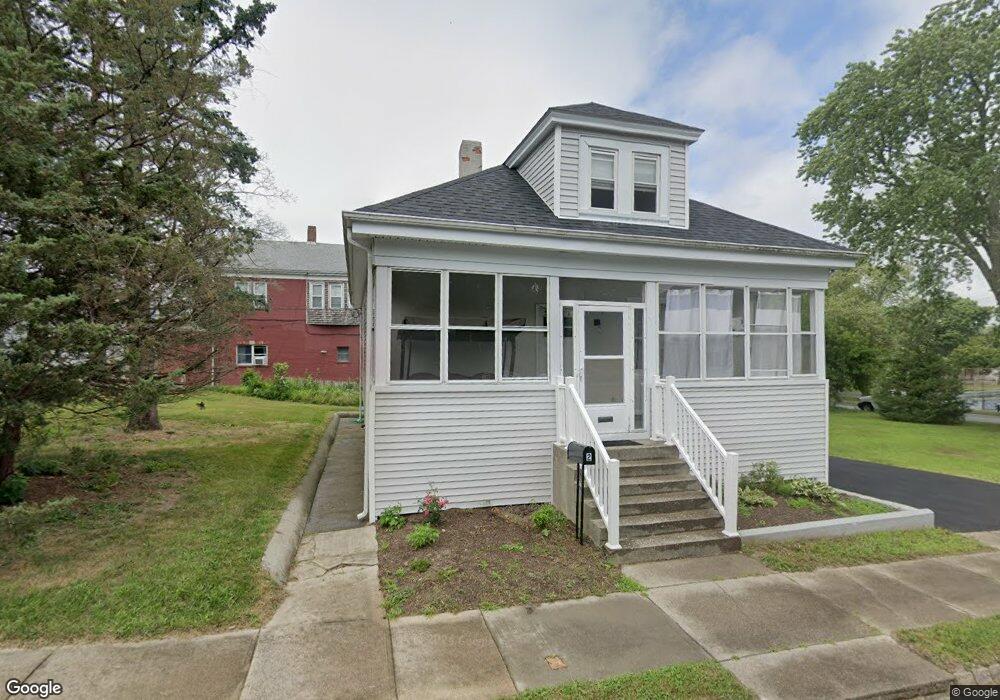
2 Ryle St Fairhaven, MA 02719
North Fairhaven NeighborhoodEstimated Value: $394,000 - $483,000
2
Beds
1
Bath
936
Sq Ft
$458/Sq Ft
Est. Value
About This Home
This home is located at 2 Ryle St, Fairhaven, MA 02719 and is currently estimated at $428,642, approximately $457 per square foot. 2 Ryle St is a home located in Bristol County with nearby schools including Fairhaven High School, Alma Del Mar Charter School, and St. Joseph School.
Ownership History
Date
Name
Owned For
Owner Type
Purchase Details
Closed on
Mar 14, 2023
Sold by
John Afonso Property Llc
Bought by
Patel Bhavesh A and Patel Pinalben B
Current Estimated Value
Home Financials for this Owner
Home Financials are based on the most recent Mortgage that was taken out on this home.
Original Mortgage
$175,000
Outstanding Balance
$169,109
Interest Rate
6.13%
Mortgage Type
Purchase Money Mortgage
Estimated Equity
$259,533
Purchase Details
Closed on
Oct 9, 2022
Sold by
Fonteneau Alfred A Est and Martin
Bought by
John Afonso Property Llc
Home Financials for this Owner
Home Financials are based on the most recent Mortgage that was taken out on this home.
Original Mortgage
$300,000
Interest Rate
5.55%
Mortgage Type
Purchase Money Mortgage
Purchase Details
Closed on
Sep 2, 1981
Bought by
Fonteneau Alfred A
Create a Home Valuation Report for This Property
The Home Valuation Report is an in-depth analysis detailing your home's value as well as a comparison with similar homes in the area
Home Values in the Area
Average Home Value in this Area
Purchase History
| Date | Buyer | Sale Price | Title Company |
|---|---|---|---|
| Patel Bhavesh A | $350,000 | None Available | |
| John Afonso Property Llc | $195,000 | None Available | |
| Fonteneau Alfred A | -- | -- |
Source: Public Records
Mortgage History
| Date | Status | Borrower | Loan Amount |
|---|---|---|---|
| Open | Patel Bhavesh A | $175,000 | |
| Previous Owner | John Afonso Property Llc | $300,000 | |
| Previous Owner | Fonteneau Alfred A | $60,000 |
Source: Public Records
Tax History Compared to Growth
Tax History
| Year | Tax Paid | Tax Assessment Tax Assessment Total Assessment is a certain percentage of the fair market value that is determined by local assessors to be the total taxable value of land and additions on the property. | Land | Improvement |
|---|---|---|---|---|
| 2025 | $34 | $365,500 | $176,500 | $189,000 |
| 2024 | $3,384 | $366,600 | $176,500 | $190,100 |
| 2023 | $2,736 | $275,000 | $154,600 | $120,400 |
| 2022 | $2,646 | $258,900 | $143,600 | $115,300 |
| 2021 | $2,500 | $221,400 | $130,000 | $91,400 |
| 2020 | $2,449 | $221,400 | $130,000 | $91,400 |
| 2019 | $2,238 | $191,800 | $107,800 | $84,000 |
| 2018 | $2,159 | $182,500 | $102,600 | $79,900 |
| 2017 | $2,126 | $176,600 | $102,600 | $74,000 |
| 2016 | $2,072 | $170,100 | $102,600 | $67,500 |
| 2015 | $2,051 | $168,800 | $102,600 | $66,200 |
Source: Public Records
Map
Nearby Homes