Estimated Value: $111,000 - $160,000
3
Beds
1
Bath
1,288
Sq Ft
$107/Sq Ft
Est. Value
About This Home
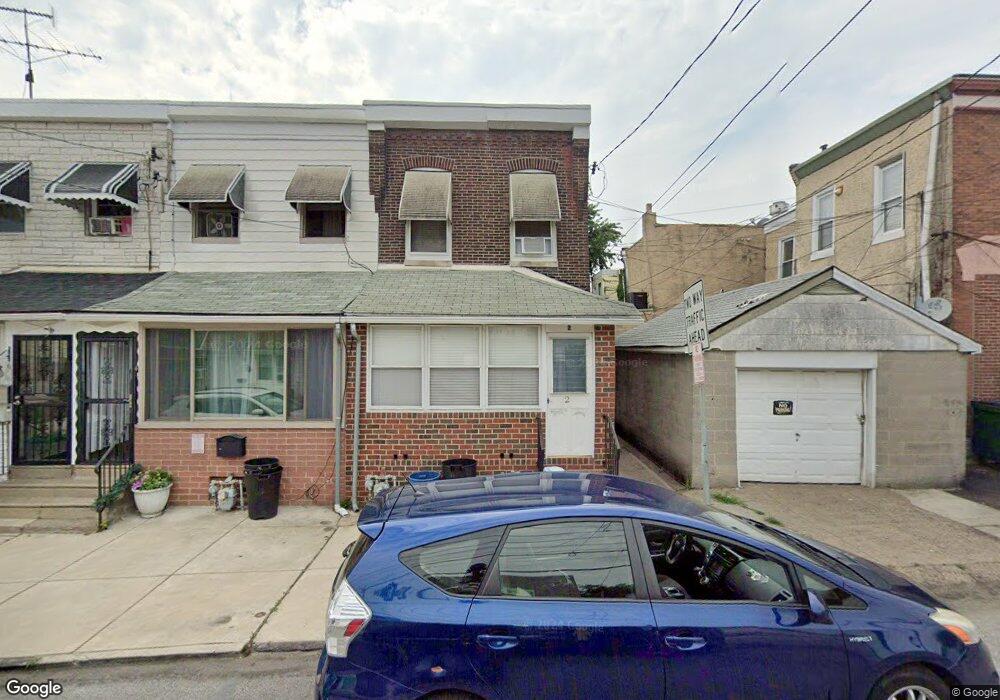
This home is located at 2 S 5th St, Darby, PA 19023 and is currently estimated at $137,579, approximately $106 per square foot. 2 S 5th St is a home located in Delaware County with nearby schools including Walnut Street Elementary School, Penn Wood Middle School, and Penn Wood High School - Cypress Street Campus.
Ownership History
Date
Name
Owned For
Owner Type
Purchase Details
Closed on
Jan 4, 2023
Sold by
Brookview Holdings Llc
Bought by
Vernell Jacob
Current Estimated Value
Home Financials for this Owner
Home Financials are based on the most recent Mortgage that was taken out on this home.
Original Mortgage
$71,250
Outstanding Balance
$68,896
Interest Rate
6.42%
Estimated Equity
$68,683
Purchase Details
Closed on
Nov 23, 2022
Sold by
Roper Sandra
Bought by
Brookview Holdings Llc
Home Financials for this Owner
Home Financials are based on the most recent Mortgage that was taken out on this home.
Original Mortgage
$71,250
Outstanding Balance
$68,896
Interest Rate
6.42%
Estimated Equity
$68,683
Purchase Details
Closed on
Jun 8, 2021
Sold by
Roper Sandra and Estate Of Julia Hausmann
Bought by
Roper Sandra
Purchase Details
Closed on
Sep 20, 1989
Sold by
Hausmann Rose R
Bought by
Hausmann Julia
Create a Home Valuation Report for This Property
The Home Valuation Report is an in-depth analysis detailing your home's value as well as a comparison with similar homes in the area
Home Values in the Area
Average Home Value in this Area
Purchase History
| Date | Buyer | Sale Price | Title Company |
|---|---|---|---|
| Vernell Jacob | $102,500 | -- | |
| Brookview Holdings Llc | $60,000 | -- | |
| Roper Sandra | -- | None Available | |
| Hausmann Julia | -- | -- |
Source: Public Records
Mortgage History
| Date | Status | Borrower | Loan Amount |
|---|---|---|---|
| Open | Vernell Jacob | $71,250 |
Source: Public Records
Tax History Compared to Growth
Tax History
| Year | Tax Paid | Tax Assessment Tax Assessment Total Assessment is a certain percentage of the fair market value that is determined by local assessors to be the total taxable value of land and additions on the property. | Land | Improvement |
|---|---|---|---|---|
| 2025 | $2,951 | $59,600 | $13,840 | $45,760 |
| 2024 | $2,951 | $59,600 | $13,840 | $45,760 |
| 2023 | $2,777 | $59,600 | $13,840 | $45,760 |
| 2022 | $2,701 | $59,600 | $13,840 | $45,760 |
| 2021 | $3,769 | $59,600 | $13,840 | $45,760 |
| 2020 | $3,269 | $44,750 | $13,120 | $31,630 |
| 2019 | $3,130 | $44,750 | $13,120 | $31,630 |
| 2018 | $3,092 | $44,750 | $0 | $0 |
| 2017 | $3,035 | $44,750 | $0 | $0 |
| 2016 | $246 | $44,750 | $0 | $0 |
| 2015 | $251 | $44,750 | $0 | $0 |
| 2014 | $246 | $44,750 | $0 | $0 |
Source: Public Records
Map
Nearby Homes